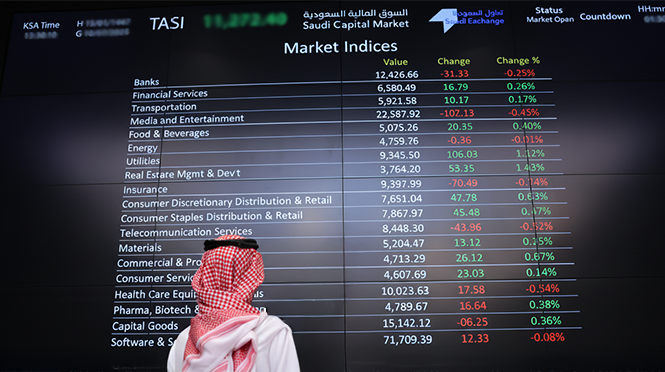
During the first 38 weeks of 2026, TASI rose in 20 weeks and declined in 18
An Argaam analysis of investor groups’ trading activity in the Saudi market from the start of 2026 through the week ended Oct. 1 showed clear differences in the behavior of retail investors, institutions, foreign investors and GCC investors alongside movements in the main market index, TASI. 
The period covered 38 weeks, during which TASI rose in 20 weeks and declined in 18.
Over the full period, Saudi individuals recorded net sales of around SAR 22 billion, while Saudi institutions posted net purchases of around SAR 12.3 billion, foreign investors SAR 6.6 billion, and GCC investors SAR 3.1 billion.
Who were the buyers and sellers since the start of the year?
Investor group
Weeks of net buying
Weeks of net selling
Net transactions
Saudi individuals
11
27
Sold SAR 22 bln
🔻
Saudi institutions
24
14
Bought SAR 12.3 bln
🟢
Foreign investors
18
20
Bought SAR 6.6 bln
🟢
GCC investors
26
12
Bought SAR 3.1 bln
🟢
The data show that Saudi individuals were the most persistent sellers during the year, recording net sales in 27 of the 38 weeks.
By contrast, Saudi institutions and GCC investors were the most consistent buyers, while foreign investors’ activity was more balanced in terms of the number of weeks, even though their purchases exceeded their sales over the full period.
What happened during weeks when TASI rose?
During the 20 weeks in which TASI advanced, Saudi individuals were the main sellers, with net sales of around SAR 26.4 billion.
Liquidity, meanwhile, came mainly from foreign investors and Saudi institutions.
Investor group
Net transactions during TASI up weeks
Foreign investors
Bought SAR 12.5 bln
🟢
Saudi institutions
Bought SAR 10.8 bln
🟢
GCC investors
Bought SAR 3.1 bln
🟢
Saudi individuals
Sold SAR 26.4 bln
🔻
Notably, individuals were net sellers in 19 of the 20 weeks in which the market rose.
Foreign investors, meanwhile, recorded net purchases in 12 of the up weeks, and the value of their purchases was sufficient to make them the largest net buyers overall during periods of market gains.
Thus, TASI’s gains in 2026 coincided primarily with liquidity shifting from individuals to foreign investors and Saudi institutions.
What happened during weeks when TASI declined?
The picture changed markedly during the 18 weeks in which the index fell.
Foreign investors switched to net selling, with net sales of around SAR 5.9 billion, while Saudi individuals became the largest net buyers, with net purchases of around SAR 4.4 billion.
Investor group
Net transactions during TASI down weeks
Saudi individuals
Bought SAR 4.4 bln
🟢
Saudi institutions
Bought SAR 1.5 bln
🟢
GCC investors
Sold SAR 36 mln
🔻
Foreign investors
Sold SAR 5.9 bln
🔻
This reflects a clear divergence in behavior between periods of gains and declines.
Overall, foreign investors tended to buy during weeks when TASI rose and sell during weeks when it fell. Saudi individuals, by contrast, tended to sell during up weeks and buy during down weeks.
This pattern was particularly evident in September, when foreign investors recorded heavy net sales as the index declined, while Saudi individuals turned to net buying.
How did each investor group move in line with TASI?
To assess how closely investors’ trading activity aligned with the market’s direction, the analysis compared TASI’s weekly movement—up or down—with each group’s net transactions—buying or selling—without taking into account the magnitude of the index’s rise or fall.
An investor’s activity was considered aligned with the market when the group recorded net buying in a week when TASI rose or net selling in a week when TASI declined.
Across the 38 weeks under review, the results were as follows:
Investors behavior
Investor group
TASI up + net buying
TASI up + net selling
TASI down + net buying
TASI down + net selling
Alignment with TASI
Foreign investors
12
8
6
12
24 of 38 weeks – 63%
GCC investors
16
4
10
8
24 of 38 weeks – 63%
Saudi institutions
14
6
10
8
22 of 38 weeks – 58%
Saudi individuals
1
19
10
8
9 of 38 weeks – 24%
The data show that foreign and GCC investors moved in line with TASI in around 63% of the weeks, while the figure for Saudi institutions was around 58%.
By contrast, Saudi individuals moved in line with TASI in only 24% of the weeks, meaning they traded against the market’s direction in around 76% of the weeks.
The divergence was more pronounced during weeks when the market rose. Saudi individuals recorded net selling in 19 of the 20 up weeks, while foreign investors recorded net buying in 12 of those weeks.
During weeks when TASI declined, foreign investors recorded net selling in 12 of the 18 down weeks, while Saudi individuals switched to net buying in 10 weeks.
During the first 38 weeks of 2026, TASI rose in 20 weeks and declined in 18
An Argaam analysis of investor groups’ trading activity in the Saudi market from the start of 2026 through the week ended Oct. 1 showed clear differences in the behavior of retail investors, institutions, foreign investors and GCC investors alongside movements in the main market index, TASI.
The period covered 38 weeks, during which TASI rose in 20 weeks and declined in 18.
Over the full period, Saudi individuals recorded net sales of around SAR 22 billion, while Saudi institutions posted net purchases of around SAR 12.3 billion, foreign investors SAR 6.6 billion, and GCC investors SAR 3.1 billion.
Who were the buyers and sellers since the start of the year?
Investor group
Weeks of net buying
Weeks of net selling
Net transactions
Saudi individuals
11
27
Sold SAR 22 bln
🔻
Saudi institutions
24
14
Bought SAR 12.3 bln
🟢
Foreign investors
18
20
Bought SAR 6.6 bln
🟢
GCC investors
26
12
Bought SAR 3.1 bln
🟢
The data show that Saudi individuals were the most persistent sellers during the year, recording net sales in 27 of the 38 weeks.
By contrast, Saudi institutions and GCC investors were the most consistent buyers, while foreign investors’ activity was more balanced in terms of the number of weeks, even though their purchases exceeded their sales over the full period.
What happened during weeks when TASI rose?
During the 20 weeks in which TASI advanced, Saudi individuals were the main sellers, with net sales of around SAR 26.4 billion.
Liquidity, meanwhile, came mainly from foreign investors and Saudi institutions.
Investor group
Net transactions during TASI up weeks
Foreign investors
Bought SAR 12.5 bln
🟢
Saudi institutions
Bought SAR 10.8 bln
🟢
GCC investors
Bought SAR 3.1 bln
🟢
Saudi individuals
Sold SAR 26.4 bln
🔻
Notably, individuals were net sellers in 19 of the 20 weeks in which the market rose.
Foreign investors, meanwhile, recorded net purchases in 12 of the up weeks, and the value of their purchases was sufficient to make them the largest net buyers overall during periods of market gains.
Thus, TASI’s gains in 2026 coincided primarily with liquidity shifting from individuals to foreign investors and Saudi institutions.
What happened during weeks when TASI declined?
The picture changed markedly during the 18 weeks in which the index fell.
Foreign investors switched to net selling, with net sales of around SAR 5.9 billion, while Saudi individuals became the largest net buyers, with net purchases of around SAR 4.4 billion.
Investor group
Net transactions during TASI down weeks
Saudi individuals
Bought SAR 4.4 bln
🟢
Saudi institutions
Bought SAR 1.5 bln
🟢
GCC investors
Sold SAR 36 mln
🔻
Foreign investors
Sold SAR 5.9 bln
🔻
This reflects a clear divergence in behavior between periods of gains and declines.
Overall, foreign investors tended to buy during weeks when TASI rose and sell during weeks when it fell. Saudi individuals, by contrast, tended to sell during up weeks and buy during down weeks.
This pattern was particularly evident in September, when foreign investors recorded heavy net sales as the index declined, while Saudi individuals turned to net buying.
How did each investor group move in line with TASI?
To assess how closely investors’ trading activity aligned with the market’s direction, the analysis compared TASI’s weekly movement—up or down—with each group’s net transactions—buying or selling—without taking into account the magnitude of the index’s rise or fall.
An investor’s activity was considered aligned with the market when the group recorded net buying in a week when TASI rose or net selling in a week when TASI declined.
Across the 38 weeks under review, the results were as follows:
Investors behavior
Investor group
TASI up + net buying
TASI up + net selling
TASI down + net buying
TASI down + net selling
Alignment with TASI
Foreign investors
12
8
6
12
24 of 38 weeks – 63%
GCC investors
16
4
10
8
24 of 38 weeks – 63%
Saudi institutions
14
6
10
8
22 of 38 weeks – 58%
Saudi individuals
1
19
10
8
9 of 38 weeks – 24%
The data show that foreign and GCC investors moved in line with TASI in around 63% of the weeks, while the figure for Saudi institutions was around 58%.
By contrast, Saudi individuals moved in line with TASI in only 24% of the weeks, meaning they traded against the market’s direction in around 76% of the weeks.
The divergence was more pronounced during weeks when the market rose. Saudi individuals recorded net selling in 19 of the 20 up weeks, while foreign investors recorded net buying in 12 of those weeks.
During weeks when TASI declined, foreign investors recorded net selling in 12 of the 18 down weeks, while Saudi individuals switched to net buying in 10 weeks.