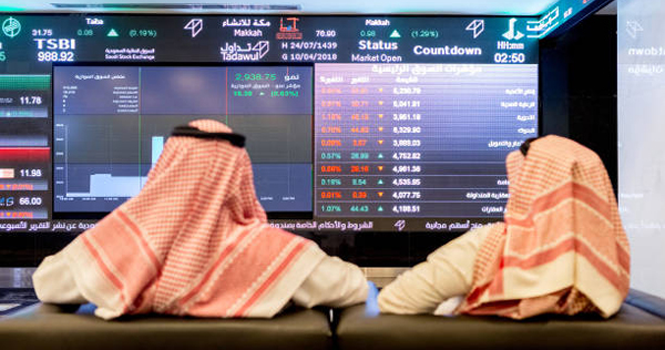
Tadawul trading screen
The market capitalization of the Saudi Exchange (Tadawul) fell 1.7%, or SAR 169.3 billion, week-on-week to about SAR 9.77 trillion in the week ended May 7, according to data issued byTadawul. 
Foreign investors’ ownership accounted for 4.68% of the total market capital.
Ownership Value by Nationality Investor Type (SAR bln)
Investor Type
April 30, 2026
May 7, 2026
Change
Saudi Investors
Retail
151.59
150.77
(0.82)
High-Net-Worth Investors
260.58
257.22
(3.36)
Individual Professional Investors
435.83
425.07
(10.76)
Individual DPMs
15.53
15.30
(0.23)
(Total Retail)
863.53
848.36
(15.17)
Corporates
1668.40
1637.52
(30.88)
Mutual Funds
307.28
301.67
(5.61)
Government Entities
6493.73
6384.27
(109.46)
Institutional DPMs
68.62
66.95
(1.67)
(Total Corporate Investors)
8538.02
8390.43
(147.59)
(Total Saudi Investors)
9401.55
9238.79
(162.76)
GCC Investors
Individuals
5.10
4.99
(0.11)
Institutions
69.05
68.20
(0.85)
DPMs
3.59
3.56
(0.03)
(Total GCC Investors)
77.74
76.76
(0.98)
Foreign Investors
SWAP Holders
10.84
10.62
(0.22)
Foreign Residents
383.01
378.46
(4.54)
Qualified Investors
2.14
2.09
(0.05)
DPMs
17.51
17.31
(0.20)
Strategic Partners
49.18
48.60
(0.58)
(Total Foreign Investors)
462.67
457.08
(5.59)
Total
9941.96
9772.62
(169.34)
Ownership Ratio by Nationality Investor Type*
Investor Type
April 30, 2026
May 7, 2026
Change
Issued Shares
Free Float
Issued Shares
Free Float
Issued Shares
Free Float
Saudi Investors
Retail
1.52%
4.44%
1.54%
4.48%
0.02%
0.04%
High-Net-Worth Investors
2.62%
7.58%
2.63%
7.59%
0.01%
0.01%
Individual Professional Investors
4.38%
9.84%
4.35%
9.90%
(0.03%)
0.06%
Individual DPMs
0.16%
0.45%
0.16%
0.45%
—
—
(Total Retail)
8.69%
22.31%
8.68%
22.42%
(0.01%)
0.11%
Corporates
16.78%
40.97%
16.76%
40.85%
(0.03%)
(0.13%)
Mutual Funds
3.09%
7.37%
3.09%
7.39%
—
0.02%
Government Entities
65.32%
13.34%
65.33%
13.31%
0.01%
(0.03%)
Institutional DPMs
0.69%
1.94%
0.69%
1.91%
(0.01%)
(0.03%)
(Total Corporate Investors)
85.88%
63.62%
85.86%
63.46%
(0.02%)
(0.16%)
(Total Saudi Investors)
94.56%
85.93%
94.54%
85.88%
(0.03%)
(0.05%)
GCC Investors
Individuals
0.05%
0.16%
0.05%
0.15%
—
(0.01%)
Institutions
0.69%
1.26%
0.70%
1.26%
0.01%
—
DPMs
0.04%
0.11%
0.04%
0.11%
—
—
(Total GCC Investors)
0.78%
1.52%
0.79%
1.52%
0.01%
—
Foreign Investors
SWAP Holders
0.11%
0.25%
0.11%
0.25%
—
—
Foreign Residents
3.85%
11.70%
3.87%
11.75%
0.02%
0.05%
Qualified Investors
0.02%
0.07%
0.02%
0.06%
—
—
DPMs
0.18%
0.53%
0.18%
0.54%
—
0.01%
Strategic Investors
0.49%
—
0.50%
—
0.01%
—
(Total Foreign Investors)
4.65%
12.55%
4.68%
12.60%
0.03%
0.05%
*Excluding corporate procedures
By investor classification, institutional investors’ ownership declined by around SAR 164.83 billion to SAR 9.35 trillion, while non-institutional investors’ ownership fell by approximately SAR 4.51 billion to SAR 423.6 billion.
Ownership’s Value Ratio by Investor Classification (SAR bln)
Investor Type
April 30, 2026
May 7, 2026
Change in Ownership
Equity
Issued Shares
Free Float
Equity
Issued Shares
Free Float
Institutional
9513.85
95.69%
87.57%
9349.02
95.67%
87.52%
(164.83)
Non-Institutional
428.11
4.31%
12.43%
423.60
4.33%
12.48%
(4.51)
Total
9941.96
100%
100%
9772.62
100%
100%
(169.34)
Tadawul trading screen
The market capitalization of the Saudi Exchange (Tadawul) fell 1.7%, or SAR 169.3 billion, week-on-week to about SAR 9.77 trillion in the week ended May 7, according to data issued byTadawul.
Foreign investors’ ownership accounted for 4.68% of the total market capital.
Ownership Value by Nationality Investor Type (SAR bln)
Investor Type
April 30, 2026
May 7, 2026
Change
Saudi Investors
Retail
151.59
150.77
(0.82)
High-Net-Worth Investors
260.58
257.22
(3.36)
Individual Professional Investors
435.83
425.07
(10.76)
Individual DPMs
15.53
15.30
(0.23)
(Total Retail)
863.53
848.36
(15.17)
Corporates
1668.40
1637.52
(30.88)
Mutual Funds
307.28
301.67
(5.61)
Government Entities
6493.73
6384.27
(109.46)
Institutional DPMs
68.62
66.95
(1.67)
(Total Corporate Investors)
8538.02
8390.43
(147.59)
(Total Saudi Investors)
9401.55
9238.79
(162.76)
GCC Investors
Individuals
5.10
4.99
(0.11)
Institutions
69.05
68.20
(0.85)
DPMs
3.59
3.56
(0.03)
(Total GCC Investors)
77.74
76.76
(0.98)
Foreign Investors
SWAP Holders
10.84
10.62
(0.22)
Foreign Residents
383.01
378.46
(4.54)
Qualified Investors
2.14
2.09
(0.05)
DPMs
17.51
17.31
(0.20)
Strategic Partners
49.18
48.60
(0.58)
(Total Foreign Investors)
462.67
457.08
(5.59)
Total
9941.96
9772.62
(169.34)
Ownership Ratio by Nationality Investor Type*
Investor Type
April 30, 2026
May 7, 2026
Change
Issued Shares
Free Float
Issued Shares
Free Float
Issued Shares
Free Float
Saudi Investors
Retail
1.52%
4.44%
1.54%
4.48%
0.02%
0.04%
High-Net-Worth Investors
2.62%
7.58%
2.63%
7.59%
0.01%
0.01%
Individual Professional Investors
4.38%
9.84%
4.35%
9.90%
(0.03%)
0.06%
Individual DPMs
0.16%
0.45%
0.16%
0.45%
—
—
(Total Retail)
8.69%
22.31%
8.68%
22.42%
(0.01%)
0.11%
Corporates
16.78%
40.97%
16.76%
40.85%
(0.03%)
(0.13%)
Mutual Funds
3.09%
7.37%
3.09%
7.39%
—
0.02%
Government Entities
65.32%
13.34%
65.33%
13.31%
0.01%
(0.03%)
Institutional DPMs
0.69%
1.94%
0.69%
1.91%
(0.01%)
(0.03%)
(Total Corporate Investors)
85.88%
63.62%
85.86%
63.46%
(0.02%)
(0.16%)
(Total Saudi Investors)
94.56%
85.93%
94.54%
85.88%
(0.03%)
(0.05%)
GCC Investors
Individuals
0.05%
0.16%
0.05%
0.15%
—
(0.01%)
Institutions
0.69%
1.26%
0.70%
1.26%
0.01%
—
DPMs
0.04%
0.11%
0.04%
0.11%
—
—
(Total GCC Investors)
0.78%
1.52%
0.79%
1.52%
0.01%
—
Foreign Investors
SWAP Holders
0.11%
0.25%
0.11%
0.25%
—
—
Foreign Residents
3.85%
11.70%
3.87%
11.75%
0.02%
0.05%
Qualified Investors
0.02%
0.07%
0.02%
0.06%
—
—
DPMs
0.18%
0.53%
0.18%
0.54%
—
0.01%
Strategic Investors
0.49%
—
0.50%
—
0.01%
—
(Total Foreign Investors)
4.65%
12.55%
4.68%
12.60%
0.03%
0.05%
*Excluding corporate procedures
By investor classification, institutional investors’ ownership declined by around SAR 164.83 billion to SAR 9.35 trillion, while non-institutional investors’ ownership fell by approximately SAR 4.51 billion to SAR 423.6 billion.
Ownership’s Value Ratio by Investor Classification (SAR bln)
Investor Type
April 30, 2026
May 7, 2026
Change in Ownership
Equity
Issued Shares
Free Float
Equity
Issued Shares
Free Float
Institutional
9513.85
95.69%
87.57%
9349.02
95.67%
87.52%
(164.83)
Non-Institutional
428.11
4.31%
12.43%
423.60
4.33%
12.48%
(4.51)
Total
9941.96
100%
100%
9772.62
100%
100%
(169.34)