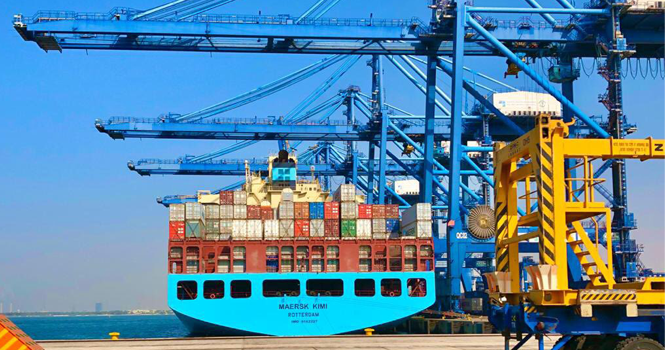
Jeddah Islamic Port
Saudi Arabia’s merchandise imports declined by 5%year-on-year (YoY) to nearly SAR 75.7 billion in April 2026. 
Compared to March 2026, merchandise imports were up 27%, or nearly SAR 16.2 billion, according to GASTAT.
Machinery, mechanical appliances, electrical equipment and their parts topped imports in April, representing 33% or SAR 25.2 billion of the Kingdom’s total imports. Vehicles, aircraft, vessels, and associated transport equipment followed, making up about 10%.
The table below shows details of Saudi imports in April by segment:
Saudi Imports in April by Segment (SAR bln)
Segment
Value
% of Total
Machinery, MechanicalAppliances, ElectricalEquipment, Their Parts
25.25
33.3%
Vehicles, Aircraft, Vessels, and Associated Transport Equipment
7.72
10.2%
Precious Stones, Metals, TheirArticles, Jewelry
6.66
8.8%
Products of the Chemical or Allied Industries
6.49
8.6%
Base Metals and Articles of Base Metal
5.59
7.4%
Mineral Products
5.26
6.9%
Vegetable Products
3.22
4.2%
Food Products, Beverages, and Tobacco
2.68
3.5%
Optical Instruments and Apparatus
2.21
2.9%
Plastics, Rubber and Their Articles
2.00
2.6%
Animal Products
1.94
2.6%
Textile Materials and Products
1.46
1.9%
Art Collections and Antiquities
1.45
1.9%
Miscellaneous Products
0.83
1.1%
Others
3.00
4.0%
Total
75.75
100.0%
Saudi Arabia’s imports came mainly from China, with SAR 22.3 billion, representing 29% of the total in April 2026. The UAE came in second with SAR 6 billion, followed by the US at SAR 5.5 billion.
The top 10 exporters to Saudi Arabia accounted for almost 71%, or SAR 53.6 billion, of total imports in the same month, as shown below:
Top 10 Exporters to Saudi Arabia in April (SAR bln)
Country
Value
% of Total
China
22.30
29.4%
UAE
6.00
7.9%
US
5.46
7.2%
Egypt
3.48
4.6%
Switzerland
3.26
4.3%
Germany
3.14
4.1%
Japan
2.82
3.7%
India
2.78
3.7%
France
2.21
2.9%
Italy
2.13
2.8%
Other Countries
22.17
29.3%
Total
75.75
100.0%
Jeddah Islamic Port
Saudi Arabia’s merchandise imports declined by 5%year-on-year (YoY) to nearly SAR 75.7 billion in April 2026.
Compared to March 2026, merchandise imports were up 27%, or nearly SAR 16.2 billion, according to GASTAT.
Machinery, mechanical appliances, electrical equipment and their parts topped imports in April, representing 33% or SAR 25.2 billion of the Kingdom’s total imports. Vehicles, aircraft, vessels, and associated transport equipment followed, making up about 10%.
The table below shows details of Saudi imports in April by segment:
Saudi Imports in April by Segment (SAR bln)
Segment
Value
% of Total
Machinery, MechanicalAppliances, ElectricalEquipment, Their Parts
25.25
33.3%
Vehicles, Aircraft, Vessels, and Associated Transport Equipment
7.72
10.2%
Precious Stones, Metals, TheirArticles, Jewelry
6.66
8.8%
Products of the Chemical or Allied Industries
6.49
8.6%
Base Metals and Articles of Base Metal
5.59
7.4%
Mineral Products
5.26
6.9%
Vegetable Products
3.22
4.2%
Food Products, Beverages, and Tobacco
2.68
3.5%
Optical Instruments and Apparatus
2.21
2.9%
Plastics, Rubber and Their Articles
2.00
2.6%
Animal Products
1.94
2.6%
Textile Materials and Products
1.46
1.9%
Art Collections and Antiquities
1.45
1.9%
Miscellaneous Products
0.83
1.1%
Others
3.00
4.0%
Total
75.75
100.0%
Saudi Arabia’s imports came mainly from China, with SAR 22.3 billion, representing 29% of the total in April 2026. The UAE came in second with SAR 6 billion, followed by the US at SAR 5.5 billion.
The top 10 exporters to Saudi Arabia accounted for almost 71%, or SAR 53.6 billion, of total imports in the same month, as shown below:
Top 10 Exporters to Saudi Arabia in April (SAR bln)
Country
Value
% of Total
China
22.30
29.4%
UAE
6.00
7.9%
US
5.46
7.2%
Egypt
3.48
4.6%
Switzerland
3.26
4.3%
Germany
3.14
4.1%
Japan
2.82
3.7%
India
2.78
3.7%
France
2.21
2.9%
Italy
2.13
2.8%
Other Countries
22.17
29.3%
Total
75.75
100.0%