


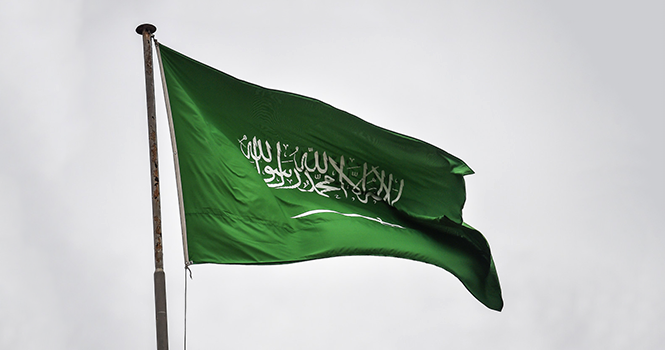
The Kingdom of Saudi Arabia’s flag
Saudi Arabia’s producer price index (PPI) rose 5.3% in July 2026 compared to July 2025. 
The PPI increased to 108.1 points in July, based on the 2023 base year, up from 102.7 points a year ago.
The authority said the change reflects price movements across the main economic activities covered by the index.
GASTAT defines the PPI as one of the key economic indicators used to assess economic performance and monitor changes in the prices of domestically produced goods at the producer level.
The index measures changes in the prices of domestically produced goods and services over specified periods, helping analyze inflationary or deflationary trends across various productive activities.
Producer Price Index
Period
Index (points)
Annual change
January 2026
104.4
+0.4%
February
104.5
+1.0%
March
109.0
+5.5%
April
112.6
+9.1%
May
110.5
+7.5%
June
111.2
+8.5%
July
108.1
+5.3%
The manufacturing sub-index rose 5.5%. The sub-index for electricity, gas, steam, and air-conditioning supply increased 2.3%.
The sub-index for water supply, sewerage, waste management, and remediation activities jumped 6.8%.
PPI by Sub-Activity
Main Activities
Weight
July 2025
July 2026
Change
Manufacturing
91.2%
103.00
108.71
+5.5%
Electricity, gas, steam, and air-conditioning supply
7.7%
97.48
99.74
+2.3%
Water supply, sanitation, waste management treatment
1.1%
113.19
120.86
+6.8%
PPI
100.0%
102.68
108.12
+5.3%
The Kingdom of Saudi Arabia’s flag
Saudi Arabia’s producer price index (PPI) rose 5.3% in July 2026 compared to July 2025.
The PPI increased to 108.1 points in July, based on the 2023 base year, up from 102.7 points a year ago.
The authority said the change reflects price movements across the main economic activities covered by the index.
GASTAT defines the PPI as one of the key economic indicators used to assess economic performance and monitor changes in the prices of domestically produced goods at the producer level.
The index measures changes in the prices of domestically produced goods and services over specified periods, helping analyze inflationary or deflationary trends across various productive activities.
Producer Price Index
Period
Index (points)
Annual change
January 2026
104.4
+0.4%
February
104.5
+1.0%
March
109.0
+5.5%
April
112.6
+9.1%
May
110.5
+7.5%
June
111.2
+8.5%
July
108.1
+5.3%
The manufacturing sub-index rose 5.5%. The sub-index for electricity, gas, steam, and air-conditioning supply increased 2.3%.
The sub-index for water supply, sewerage, waste management, and remediation activities jumped 6.8%.
PPI by Sub-Activity
Main Activities
Weight
July 2025
July 2026
Change
Manufacturing
91.2%
103.00
108.71
+5.5%
Electricity, gas, steam, and air-conditioning supply
7.7%
97.48
99.74
+2.3%
Water supply, sanitation, waste management treatment
1.1%
113.19
120.86
+6.8%
PPI
100.0%
102.68
108.12
+5.3%




