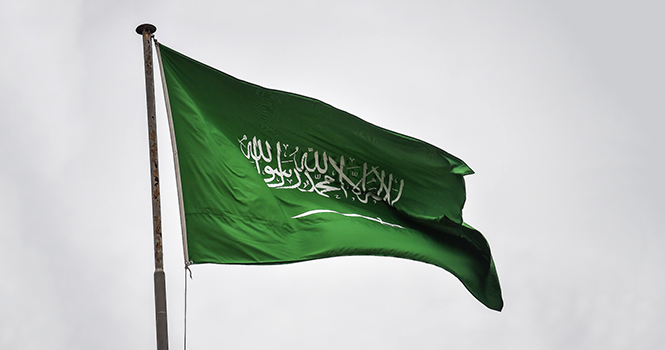
The Kingdom of Saudi Arabia’s flag
The value of Saudi Arabia’s service exports reached SAR 59.5 billion in Q2 2026, a 4% decline year-on-year. 
Compared to Q1 2026, services exports fell by 16.5%, or SAR 11.8 billion, according to the international trade in services statistics issued by the General Authority for Statistics (GASTAT).
The report covers a range of services, including transportation, travel, financial services, telecommunications, and other internationally traded services.
International Trade in Services Exports
Period
Value (SAR bln)
YoY Change
Q1 2023
52.91
—
Q2
66.98
—
Q3
37.51
—
Q4
47.23
—
Q1 2024
64.15
+21%
Q2
68.72
+3%
Q3
46.03
+23%
Q4
56.56
+20%
Q1 2025
73.86
+15%
Q2
62.15
(10%)
Q3
58.19
+26%
Q4
66.09
+17%
Q1 2026
71.30
(3%)
Q2
59.53
(4%)
Travel services recorded the highest export value at SAR 33.8 billion, representing 56.8% of total service exports, with personal travel accounting for roughly 93.9% of that figure.
Transport services followed with SAR 10.5 billion (17.6% of total).
Value of Services Exports by Category
Category
Value (SAR bln)
% to Total
Travel
33.79
56.8%
Transportation
10.47
17.6%
Telecommunications, Computer Information
2.61
4.4%
Other Business Services
2.35
3.9%
Construction
1.83
3.1%
Government Services
1.83
3.1%
Financial Services
1.55
2.6%
Manufacturing Services
1.43
2.4%
Insurance Pension Services
1.39
2.3%
Personal, Cultural Recreational Services
1.14
1.9%
Maintenance Repair Services
0.94
1.6%
Intellectual Property Charges
0.23
0.4%
Total
59.53
100.0%
Meanwhile, Saudi Arabia’s services imports reached SAR 120.8 billion in Q2 2026, a 5% decrease YoY. However, they rose 8.4% quarter-on-quarter.
International Trade in Service Imports
Period
Value (SAR bln)
YoY Change
Q1 2023
105.92
—
Q2
108.69
—
Q3
107.04
—
Q4
110.44
—
Q1 2024
111.60
+5%
Q2
119.92
+10%
Q3
114.73
+7%
Q4
122.79
+11%
Q1 2025
115.08
+3%
Q2
127.06
+6%
Q3
120.83
+5%
Q4
119.59
(3%)
Q1 2026
111.43
(3%)
Q2
120.85
(5%)
Transport services accounted for the largest share at SAR 34.1 billion, or 28.2% of total imports, followed by travel services at nearly SAR 25 billion.
Value of Service Imports by Category
Category
Value (SAR bln)
% to Total
Transportation
34.11
28.2%
Travel
24.96
20.7%
Other Business Services
18.77
15.5%
Construction
14.52
12.0%
Government Services
7.29
6.0%
Insurance Pension Services
5.96
4.9%
Telecommunications, Computer Information
3.98
3.3%
Manufacturing Services
3.16
2.6%
Personal, Cultural Recreational Services
2.56
2.1%
Financial Services
2.23
1.8%
Intellectual Property Charges
1.74
1.4%
Maintenance Repair Services
1.57
1.5%
Total
120.85
100.0%
The data showed that the Kingdom’s services trade balance posted a deficit of around SAR 61.3 billion in Q2 2026.
International Trade in Services Balance (SAR bln)
Category
2023
Q1 2023
(53.01)
Q2
(41.70)
Q3
(69.53)
Q4
(63.21)
Q1 2024
(47.45)
Q2
(51.20)
Q3
(68.70)
Q4
(66.22)
Q1 2025
(41.22)
Q2
(64.90)
Q3
(62.64)
Q4
(53.50)
Q1 2026
(40.12)
Q2
(61.32)
The Kingdom of Saudi Arabia’s flag
The value of Saudi Arabia’s service exports reached SAR 59.5 billion in Q2 2026, a 4% decline year-on-year.
Compared to Q1 2026, services exports fell by 16.5%, or SAR 11.8 billion, according to the international trade in services statistics issued by the General Authority for Statistics (GASTAT).
The report covers a range of services, including transportation, travel, financial services, telecommunications, and other internationally traded services.
International Trade in Services Exports
Period
Value (SAR bln)
YoY Change
Q1 2023
52.91
—
Q2
66.98
—
Q3
37.51
—
Q4
47.23
—
Q1 2024
64.15
+21%
Q2
68.72
+3%
Q3
46.03
+23%
Q4
56.56
+20%
Q1 2025
73.86
+15%
Q2
62.15
(10%)
Q3
58.19
+26%
Q4
66.09
+17%
Q1 2026
71.30
(3%)
Q2
59.53
(4%)
Travel services recorded the highest export value at SAR 33.8 billion, representing 56.8% of total service exports, with personal travel accounting for roughly 93.9% of that figure.
Transport services followed with SAR 10.5 billion (17.6% of total).
Value of Services Exports by Category
Category
Value (SAR bln)
% to Total
Travel
33.79
56.8%
Transportation
10.47
17.6%
Telecommunications, Computer Information
2.61
4.4%
Other Business Services
2.35
3.9%
Construction
1.83
3.1%
Government Services
1.83
3.1%
Financial Services
1.55
2.6%
Manufacturing Services
1.43
2.4%
Insurance Pension Services
1.39
2.3%
Personal, Cultural Recreational Services
1.14
1.9%
Maintenance Repair Services
0.94
1.6%
Intellectual Property Charges
0.23
0.4%
Total
59.53
100.0%
Meanwhile, Saudi Arabia’s services imports reached SAR 120.8 billion in Q2 2026, a 5% decrease YoY. However, they rose 8.4% quarter-on-quarter.
International Trade in Service Imports
Period
Value (SAR bln)
YoY Change
Q1 2023
105.92
—
Q2
108.69
—
Q3
107.04
—
Q4
110.44
—
Q1 2024
111.60
+5%
Q2
119.92
+10%
Q3
114.73
+7%
Q4
122.79
+11%
Q1 2025
115.08
+3%
Q2
127.06
+6%
Q3
120.83
+5%
Q4
119.59
(3%)
Q1 2026
111.43
(3%)
Q2
120.85
(5%)
Transport services accounted for the largest share at SAR 34.1 billion, or 28.2% of total imports, followed by travel services at nearly SAR 25 billion.
Value of Service Imports by Category
Category
Value (SAR bln)
% to Total
Transportation
34.11
28.2%
Travel
24.96
20.7%
Other Business Services
18.77
15.5%
Construction
14.52
12.0%
Government Services
7.29
6.0%
Insurance Pension Services
5.96
4.9%
Telecommunications, Computer Information
3.98
3.3%
Manufacturing Services
3.16
2.6%
Personal, Cultural Recreational Services
2.56
2.1%
Financial Services
2.23
1.8%
Intellectual Property Charges
1.74
1.4%
Maintenance Repair Services
1.57
1.5%
Total
120.85
100.0%
The data showed that the Kingdom’s services trade balance posted a deficit of around SAR 61.3 billion in Q2 2026.
International Trade in Services Balance (SAR bln)
Category
2023
Q1 2023
(53.01)
Q2
(41.70)
Q3
(69.53)
Q4
(63.21)
Q1 2024
(47.45)
Q2
(51.20)
Q3
(68.70)
Q4
(66.22)
Q1 2025
(41.22)
Q2
(64.90)
Q3
(62.64)
Q4
(53.50)
Q1 2026
(40.12)
Q2
(61.32)