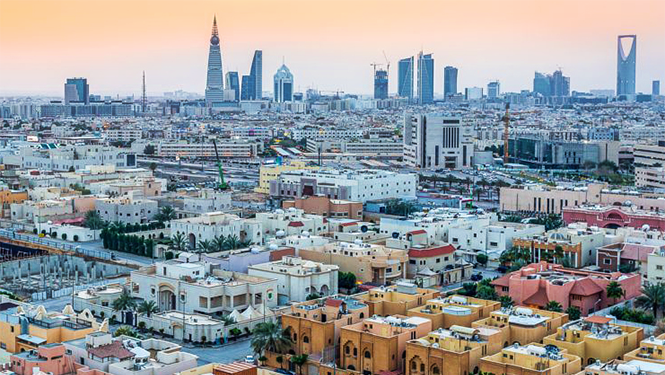
Riyadh city
The value of real estate transactions in Saudi Arabia decreased by 32% in July 2026 to around SAR 35.5 billion from SAR 51.9 billion in the same month a year earlier. 
This was driven by a 43% decline in the value of residential transactions to SAR 19.8 billion from around SAR 35 billion in July 2025, in addition to a 7% decline in the value of non-residential transactions to SAR 15.7 billion, according to data from the Real Estate General Authority (REGA).
Residential transactions accounted for approximately 55.8% of total real estate transaction value in July, while non-residential transactions represented around 44.2%.
Transaction Value by Sector (SAR bln)
Sector
July 2025
July 2026
Change
Percentage of Total
Residential
t
19.82
(43%)
55.8%
Non-Residential
16.88
15.72
(7%)
44.2%
Total
51.93
35.54
(32%)
100.0%
Real Estate Transactions by Sector (SAR bln)
Month*
Residential
Non-residential
Total
January 2026
17.52
10.96
28.48
February
14.65
9.39
24.04
March
12.03
7.34
19.37
April
18.07
11.24
29.31
May
14.14
8.47
22.61
June
15.02
8.65
23.67
July
19.82
15.72
35.54
The number of real estate transactions fell 15% YoY, with both residential and non-residential sectors declining 13% and 27%, respectively.
No. of Transactions by Sector
Sector
July 2025
July 2026
Change
Residential
26340
22837
(13%)
Non-Residential
3154
2314
(27%)
Total
29494
25151
(15%)
Land plots accounted for the largest share of residential transactions in July, with deals totaling SAR 9.82 billion, representing about 50% of the total value. Villas and apartments followed with SAR 3.52 billion and SAR 3.4 billion, respectively.
Residential transaction values varied across all property types year-on-year (YoY), with residential floors recording the strongest increase, rising 39% YoY.
Residential Transaction Value by Property Type (SAR bln)
Type
July 2025
July 2026
Change
Land
11.58
9.82
(15%)
Apartment
3.91
3.40
(13%)
Villa
3.63
3.52
(3%)
Duplex
1.09
0.98
(10%)
Floor
0.63
0.87
39%
Others
14.21
1.21
(91%)
Total
35.04
19.82
(43%)
The data also showed a decline in residential real estate transactions across most property types in July compared with the same period a year earlier, except for villas and floors, which increased 24% and 41%, respectively.
No. of Residential Transactions by Property Type
Type
July 2025
July 2026
Change
Land
15279
12234
(20%)
Apartment
5890
5324
(10%)
Villa
1916
2382
24%
Floor
696
981
41%
Duplex
830
818
(1%)
Others
1729
1098
(36%)
Total
26340
22837
(13%)
REGA explained that liquidity was concentrated in major regions, with Riyadh accounting for 44% of total transaction value, followed by Makkah (28%) and the Eastern Province (12%). Together, the three regions accounted for 84% of total real estate transaction value.
Top Administrative Regions by Transaction Value
Region
Value (SAR bln)
Share
Riyadh
15.68
44.1%
Makkah
10.09
28.4%
Eastern Province
4.13
11.6%
Madinah
2.84
8.0%
Qassim
0.57
1.6%
Riyadh also led in transaction volume, accounting for 31% of total deals executed across the Kingdom. It was followed by Makkah (21%) and the Eastern Province (15%).
Top Administrative Regions by No. of Transactions
Region
Transactions
Share
Riyadh
7670
31%
Makkah
5279
21%
Eastern Province
3722
15%
Qassim
1967
8%
Madinah
1254
5%
Rental deal values jump 25% to SAR 10.6 billion in July, driven by residential sector
Rental transaction value increased 25% YoY to around SAR 10.6 billion in July, compared to SAR 8.5 billion a year earlier.
This was driven by a 28% increase in the value of residential lease transactions to around SAR 5.6 billion from SAR 4.4 billion in July 2025, accounting for 53% of total lease transactions.
Rental Transaction Value by Sector (SAR bln)
Sector
July 2025
July 2026
Change
Residential
4.37
5.59
28%
Non-Residential
4.13
5.01
21%
Total
8.50
10.60
25%
Total rental deals rose 26% to 417,900 in July, up from nearly 331,200 in the year-earlier period.
Residential rentals increased 25%, compared to a 29% rise for the non-residential sector.
No. of Rental Transactions by Sector
Sector
July 2025
July 2026
Change
Residential
252059
315853
25%
Non-Residential
79110
102069
29%
Total
331169
417922
26%
The number of rental contracts in Saudi Arabia rose 28% YoY in July 2026 to 356,000, driven by growth in both residential and non-residential leases.
Residential lease contracts increased 27% YoY to 284,000, while non-residential lease contracts grew 33% annually to 71,900.
No. of Rental Contracts by Sector
Sector
July 2025
July 2026
Change
Residential
223780
284044
27%
Non-Residential
54069
71906
33%
Total
277849
355950
28%
Riyadh led the way among administrative regions by rental transaction value at SAR 4.43 billion, followed by Makkah (SAR 2.96 billion).
Top Administrative Regions by Rental Transaction Value
Region
Value (SAR bln)
Share
Riyadh
4.43
41.8%
Makkah
2.96
28.0%
Eastern Province
1.40
13.2%
Madinah
0.59
5.6%
Aseer
0.30
2.9%
The Saudi capital also ranked first in rental transactions, recording 136,100 deals, representing 33% of total transactions across the Kingdom.
Makkah came second with 112,700 transactions (27%), followed by the Eastern Province with 65,900 transactions (16%).
Top Administrative Regions by No. of Rental Transactions
Region
Transactions
Share
Riyadh
136054
32.6%
Makkah
112695
27.0%
Eastern Province
65918
15.8%
Madinah
26452
6.3%
Aseer
17872
4.3%
Riyadh city
The value of real estate transactions in Saudi Arabia decreased by 32% in July 2026 to around SAR 35.5 billion from SAR 51.9 billion in the same month a year earlier.
This was driven by a 43% decline in the value of residential transactions to SAR 19.8 billion from around SAR 35 billion in July 2025, in addition to a 7% decline in the value of non-residential transactions to SAR 15.7 billion, according to data from the Real Estate General Authority (REGA).
Residential transactions accounted for approximately 55.8% of total real estate transaction value in July, while non-residential transactions represented around 44.2%.
Transaction Value by Sector (SAR bln)
Sector
July 2025
July 2026
Change
Percentage of Total
Residential
t
19.82
(43%)
55.8%
Non-Residential
16.88
15.72
(7%)
44.2%
Total
51.93
35.54
(32%)
100.0%
Real Estate Transactions by Sector (SAR bln)
Month*
Residential
Non-residential
Total
January 2026
17.52
10.96
28.48
February
14.65
9.39
24.04
March
12.03
7.34
19.37
April
18.07
11.24
29.31
May
14.14
8.47
22.61
June
15.02
8.65
23.67
July
19.82
15.72
35.54
The number of real estate transactions fell 15% YoY, with both residential and non-residential sectors declining 13% and 27%, respectively.
No. of Transactions by Sector
Sector
July 2025
July 2026
Change
Residential
26340
22837
(13%)
Non-Residential
3154
2314
(27%)
Total
29494
25151
(15%)
Land plots accounted for the largest share of residential transactions in July, with deals totaling SAR 9.82 billion, representing about 50% of the total value. Villas and apartments followed with SAR 3.52 billion and SAR 3.4 billion, respectively.
Residential transaction values varied across all property types year-on-year (YoY), with residential floors recording the strongest increase, rising 39% YoY.
Residential Transaction Value by Property Type (SAR bln)
Type
July 2025
July 2026
Change
Land
11.58
9.82
(15%)
Apartment
3.91
3.40
(13%)
Villa
3.63
3.52
(3%)
Duplex
1.09
0.98
(10%)
Floor
0.63
0.87
39%
Others
14.21
1.21
(91%)
Total
35.04
19.82
(43%)
The data also showed a decline in residential real estate transactions across most property types in July compared with the same period a year earlier, except for villas and floors, which increased 24% and 41%, respectively.
No. of Residential Transactions by Property Type
Type
July 2025
July 2026
Change
Land
15279
12234
(20%)
Apartment
5890
5324
(10%)
Villa
1916
2382
24%
Floor
696
981
41%
Duplex
830
818
(1%)
Others
1729
1098
(36%)
Total
26340
22837
(13%)
REGA explained that liquidity was concentrated in major regions, with Riyadh accounting for 44% of total transaction value, followed by Makkah (28%) and the Eastern Province (12%). Together, the three regions accounted for 84% of total real estate transaction value.
Top Administrative Regions by Transaction Value
Region
Value (SAR bln)
Share
Riyadh
15.68
44.1%
Makkah
10.09
28.4%
Eastern Province
4.13
11.6%
Madinah
2.84
8.0%
Qassim
0.57
1.6%
Riyadh also led in transaction volume, accounting for 31% of total deals executed across the Kingdom. It was followed by Makkah (21%) and the Eastern Province (15%).
Top Administrative Regions by No. of Transactions
Region
Transactions
Share
Riyadh
7670
31%
Makkah
5279
21%
Eastern Province
3722
15%
Qassim
1967
8%
Madinah
1254
5%
Rental deal values jump 25% to SAR 10.6 billion in July, driven by residential sector
Rental transaction value increased 25% YoY to around SAR 10.6 billion in July, compared to SAR 8.5 billion a year earlier.
This was driven by a 28% increase in the value of residential lease transactions to around SAR 5.6 billion from SAR 4.4 billion in July 2025, accounting for 53% of total lease transactions.
Rental Transaction Value by Sector (SAR bln)
Sector
July 2025
July 2026
Change
Residential
4.37
5.59
28%
Non-Residential
4.13
5.01
21%
Total
8.50
10.60
25%
Total rental deals rose 26% to 417,900 in July, up from nearly 331,200 in the year-earlier period.
Residential rentals increased 25%, compared to a 29% rise for the non-residential sector.
No. of Rental Transactions by Sector
Sector
July 2025
July 2026
Change
Residential
252059
315853
25%
Non-Residential
79110
102069
29%
Total
331169
417922
26%
The number of rental contracts in Saudi Arabia rose 28% YoY in July 2026 to 356,000, driven by growth in both residential and non-residential leases.
Residential lease contracts increased 27% YoY to 284,000, while non-residential lease contracts grew 33% annually to 71,900.
No. of Rental Contracts by Sector
Sector
July 2025
July 2026
Change
Residential
223780
284044
27%
Non-Residential
54069
71906
33%
Total
277849
355950
28%
Riyadh led the way among administrative regions by rental transaction value at SAR 4.43 billion, followed by Makkah (SAR 2.96 billion).
Top Administrative Regions by Rental Transaction Value
Region
Value (SAR bln)
Share
Riyadh
4.43
41.8%
Makkah
2.96
28.0%
Eastern Province
1.40
13.2%
Madinah
0.59
5.6%
Aseer
0.30
2.9%
The Saudi capital also ranked first in rental transactions, recording 136,100 deals, representing 33% of total transactions across the Kingdom.
Makkah came second with 112,700 transactions (27%), followed by the Eastern Province with 65,900 transactions (16%).
Top Administrative Regions by No. of Rental Transactions
Region
Transactions
Share
Riyadh
136054
32.6%
Makkah
112695
27.0%
Eastern Province
65918
15.8%
Madinah
26452
6.3%
Aseer
17872
4.3%