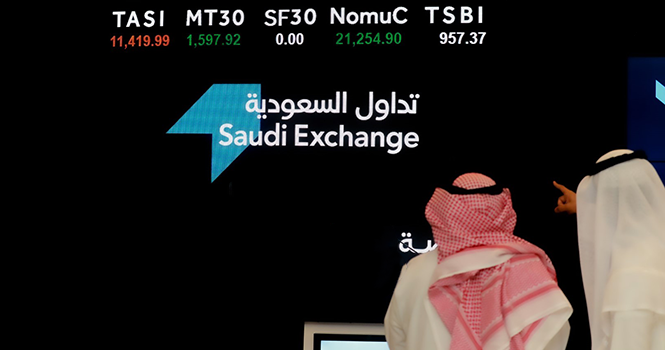
Tadawul trading screen
Tadawul’s TASI ended the third quarter of 2026 down 3.3%, losing about 359 points to close at 10,441, compared with 10,800 points at the end of Q2. 
The decline erased the index’s gains for the year, leaving it down 0.5%, or 50 points, from its 2025 year-end close of 10,491. TASI gained 7.2% in Q1 before falling 4% in Q2.
Market performance during Q3 was affected by several developments, most notably the continued US-Iran war, volatile oil prices, and higher interest rates. Key developments during the quarter included:
Capital Market Authority developments: The third quarter saw the issuance of a Royal Order on Aug. 13, appointing Mazen bin Turki Al-Sudairi as Chairman of the Capital Market Authority (CMA) Board, with the rank of minister.
The CMA also put several regulatory initiatives out for public consultation, including measures to improve IPO practices, regulate algorithmic trading, regulate the conduct of securities dealing activities outside the Kingdom, and establish rules governing earnings discussion meetings for listed companies.
Stalled talks to end the US-Iran war: Talks aimed at ending the war remained deadlocked amid continued political impasse.
Oil price volatility and disruption to Hormuz supplies: Energy markets remained concerned about disruptions to shipping through the Strait of Hormuz and their impact on oil flows. The East-West pipeline was subsequently shut down after being targeted, pushing oil prices higher, with Brent crude rising above $102 per barrel.
OPEC+ production decisions: OPEC+ continued to gradually manage production levels to address global supply shortages and meet rising demand.
Interest rate hike: The US Federal Reserve shifted its monetary policy by raising interest rates by 25 basis points to a range of 3.75% to 4.00%.
Saudi Q2 2026 budget results: The Ministry of Finance announced the Kingdom’s actual budget performance for Q2 2026, with revenue rising significantly to SAR 339 billion, while actual expenditure stood at SAR 373 billion. This narrowed the quarterly budget deficit to SAR 34 billion.
Historical performance over the past 10 years shows continued quarter-to-quarter volatility, with the market affected by domestic and global economic and geopolitical developments.
Quarterly performance of the market index since 2016
Period
Opening (points)
Closing (points)
Change
2016
Q1 2016
6,912
6,223
(10.0%)
Q2 2016
6,223
6,500
+4.4%
Q3 2016
6,500
5,623
(13.5%)
Q4 2016
5,623
7,210
+28.2%
2017
Q1 2017
7,210
7,002
(2.9%)
Q2 2017
7,002
7,426
+6.1%
Q3 2017
7,426
7,283
(1.9%)
Q4 2017
7,283
7,226
(0.8%)
2018
Q1 2018
7,226
7,871
+8.9%
Q2 2018
7,871
8,314
+5.6%
Q3 2018
8,314
8,000
(3.8%)
Q4 2018
8,000
7,827
(2.2%)
2019
Q1 2019
7,827
8,819
+12.7%
Q2 2019
8,819
8,822
+0.03%
Q3 2019
8,822
8,092
(8.3%)
Q4 2019
8,092
8,389
+3.7%
2020
Q1 2020
8,389
6,505
(22.5%)
Q2 2020
6,505
7,224
+11.0%
Q3 2020
7,224
8,299
+14.9%
Q4 2020
8,299
8,690
+4.7%
2021
Q1 2021
8,690
9,908
+14.0%
Q2 2021
9,908
10,984
+10.9%
Q3 2021
10,984
11,496
+4.7%
Q4 2021
11,496
11,282
(1.9%)
2022
Q1 2022
11,282
13,090
+16.0%
Q2 2022
13,090
11,523
(12.0%)
Q3 2022
11,523
11,405
(1.0%)
Q4 2022
11,405
10,478
(8.1%)
2023
Q1 2023
10,478
10,590
+1.1%
Q2 2023
10,590
11,459
+8.2%
Q3 2023
11,459
11,056
(3.5%)
Q4 2023
11,056
11,967
+8.2%
2024
Q1 2024
11,967
12,402
+3.6%
Q2 2024
12,402
11,680
(5.8%)
Q3 2024
11,680
12,226
+4.7%
Q4 2024
12,226
12,037
(1.5%)
2025
Q1 2025
12,037
12,025
(0.1%)
Q2 2025
12,025
11,164
(7.2%)
Q3 2025
11,164
11,503
+3.0%
Q4 2025
11,503
10,491
(8.8%)
2026
Q1 2026
10,491
11,250
+7.2%
Q2 2026
11,250
10,800
(4.0%)
Q3 2026
10,800
10,441
(3.3%)
Monthly performance
TASI’s monthly performance during the first nine months of 2026 was mixed. The index rose in January and March but declined in February, followed by consecutive monthly declines throughout Q2 and into July. It then rebounded sharply in August before falling again in September.
Monthly index performance
Month
Closing (points)
Change (points)
Change (%)
January
11,382
+891
+8.5%
February
10,709
(673)
(5.9%)
March
11,250
+541
+5.1%
April
11,188
(62)
(0.6%)
May
11,078
(110)
(1.0%)
June
10,800
(278)
(2.5%)
July
10,590
(210)
(2.0%)
August
11,127
+537
+5.1%
September
10,441
(686)
(6.2%)
Insurance leads sector gains in 9 months 2026; Media and entertainment falls 54%
17 sectors declined during the first nine months of 2026, led by media and entertainment, which fell 54%, followed by transportation, down 23%, and commercial professional services, which declined 17%.
Five sectors, meanwhile, posted gains, led by insurance, which rose 11%, and energy, up 7%. Banks advanced 2%.
Sector performance in 9M 2026
Sector
2025
9M 2026
Change (points)
Change (%)
Energy
4,545
4,848
+303
+7%
Materials
4,943
4,728
(215)
(4%)
Capital Goods
14,930
13,888
(1,042)
(7%)
Commercial Professional Services
4,035
3,344
(691)
(17%)
Transportation
4,936
3,807
(1,129)
(23%)
Consumer Durables Apparel
3,536
3,095
(441)
(12%)
Consumer Services
3,522
3,279
(243)
(7%)
Media and Entertainment
16,205
7,421
(8,784)
(54%)
Consumer Discretionary Distribution Retail
7,437
7,126
(311)
(4%)
Consumer Staples Distribution Retail
5,704
4,989
(715)
(13%)
Food Beverages
4,347
4,209
(138)
(3%)
Household Personal Products
4,568
4,002
(566)
(12%)
Health Care Equipment Services
9,868
8,617
(1,251)
(13%)
Pharma, Biotech Life Science
4,373
4,432
+59
+1%
Financial Services
5,404
4,619
(785)
(15%)
Software Services
58,137
50,810
(7,327)
(13%)
Real Estate Management Development
2,877
2,932
+55
+2%
Insurance
7,447
8,273
+826
+11%
REITs
2,922
2,712
(210)
(7%)
Banks
12,255
12,551
+296
+2%
Telecommunication Services
8,763
8,629
(134)
(2%)
Utilities
7,283
6,771
(512)
(7%)
Market
10,491
10,441
(50)
(0.5%)
Tadawul trading screen
Tadawul’s TASI ended the third quarter of 2026 down 3.3%, losing about 359 points to close at 10,441, compared with 10,800 points at the end of Q2.
The decline erased the index’s gains for the year, leaving it down 0.5%, or 50 points, from its 2025 year-end close of 10,491. TASI gained 7.2% in Q1 before falling 4% in Q2.
Market performance during Q3 was affected by several developments, most notably the continued US-Iran war, volatile oil prices, and higher interest rates. Key developments during the quarter included:
Capital Market Authority developments: The third quarter saw the issuance of a Royal Order on Aug. 13, appointing Mazen bin Turki Al-Sudairi as Chairman of the Capital Market Authority (CMA) Board, with the rank of minister.
The CMA also put several regulatory initiatives out for public consultation, including measures to improve IPO practices, regulate algorithmic trading, regulate the conduct of securities dealing activities outside the Kingdom, and establish rules governing earnings discussion meetings for listed companies.
Stalled talks to end the US-Iran war: Talks aimed at ending the war remained deadlocked amid continued political impasse.
Oil price volatility and disruption to Hormuz supplies: Energy markets remained concerned about disruptions to shipping through the Strait of Hormuz and their impact on oil flows. The East-West pipeline was subsequently shut down after being targeted, pushing oil prices higher, with Brent crude rising above $102 per barrel.
OPEC+ production decisions: OPEC+ continued to gradually manage production levels to address global supply shortages and meet rising demand.
Interest rate hike: The US Federal Reserve shifted its monetary policy by raising interest rates by 25 basis points to a range of 3.75% to 4.00%.
Saudi Q2 2026 budget results: The Ministry of Finance announced the Kingdom’s actual budget performance for Q2 2026, with revenue rising significantly to SAR 339 billion, while actual expenditure stood at SAR 373 billion. This narrowed the quarterly budget deficit to SAR 34 billion.
Historical performance over the past 10 years shows continued quarter-to-quarter volatility, with the market affected by domestic and global economic and geopolitical developments.
Quarterly performance of the market index since 2016
Period
Opening (points)
Closing (points)
Change
2016
Q1 2016
6,912
6,223
(10.0%)
Q2 2016
6,223
6,500
+4.4%
Q3 2016
6,500
5,623
(13.5%)
Q4 2016
5,623
7,210
+28.2%
2017
Q1 2017
7,210
7,002
(2.9%)
Q2 2017
7,002
7,426
+6.1%
Q3 2017
7,426
7,283
(1.9%)
Q4 2017
7,283
7,226
(0.8%)
2018
Q1 2018
7,226
7,871
+8.9%
Q2 2018
7,871
8,314
+5.6%
Q3 2018
8,314
8,000
(3.8%)
Q4 2018
8,000
7,827
(2.2%)
2019
Q1 2019
7,827
8,819
+12.7%
Q2 2019
8,819
8,822
+0.03%
Q3 2019
8,822
8,092
(8.3%)
Q4 2019
8,092
8,389
+3.7%
2020
Q1 2020
8,389
6,505
(22.5%)
Q2 2020
6,505
7,224
+11.0%
Q3 2020
7,224
8,299
+14.9%
Q4 2020
8,299
8,690
+4.7%
2021
Q1 2021
8,690
9,908
+14.0%
Q2 2021
9,908
10,984
+10.9%
Q3 2021
10,984
11,496
+4.7%
Q4 2021
11,496
11,282
(1.9%)
2022
Q1 2022
11,282
13,090
+16.0%
Q2 2022
13,090
11,523
(12.0%)
Q3 2022
11,523
11,405
(1.0%)
Q4 2022
11,405
10,478
(8.1%)
2023
Q1 2023
10,478
10,590
+1.1%
Q2 2023
10,590
11,459
+8.2%
Q3 2023
11,459
11,056
(3.5%)
Q4 2023
11,056
11,967
+8.2%
2024
Q1 2024
11,967
12,402
+3.6%
Q2 2024
12,402
11,680
(5.8%)
Q3 2024
11,680
12,226
+4.7%
Q4 2024
12,226
12,037
(1.5%)
2025
Q1 2025
12,037
12,025
(0.1%)
Q2 2025
12,025
11,164
(7.2%)
Q3 2025
11,164
11,503
+3.0%
Q4 2025
11,503
10,491
(8.8%)
2026
Q1 2026
10,491
11,250
+7.2%
Q2 2026
11,250
10,800
(4.0%)
Q3 2026
10,800
10,441
(3.3%)
Monthly performance
TASI’s monthly performance during the first nine months of 2026 was mixed. The index rose in January and March but declined in February, followed by consecutive monthly declines throughout Q2 and into July. It then rebounded sharply in August before falling again in September.
Monthly index performance
Month
Closing (points)
Change (points)
Change (%)
January
11,382
+891
+8.5%
February
10,709
(673)
(5.9%)
March
11,250
+541
+5.1%
April
11,188
(62)
(0.6%)
May
11,078
(110)
(1.0%)
June
10,800
(278)
(2.5%)
July
10,590
(210)
(2.0%)
August
11,127
+537
+5.1%
September
10,441
(686)
(6.2%)
Insurance leads sector gains in 9 months 2026; Media and entertainment falls 54%
17 sectors declined during the first nine months of 2026, led by media and entertainment, which fell 54%, followed by transportation, down 23%, and commercial professional services, which declined 17%.
Five sectors, meanwhile, posted gains, led by insurance, which rose 11%, and energy, up 7%. Banks advanced 2%.
Sector performance in 9M 2026
Sector
2025
9M 2026
Change (points)
Change (%)
Energy
4,545
4,848
+303
+7%
Materials
4,943
4,728
(215)
(4%)
Capital Goods
14,930
13,888
(1,042)
(7%)
Commercial Professional Services
4,035
3,344
(691)
(17%)
Transportation
4,936
3,807
(1,129)
(23%)
Consumer Durables Apparel
3,536
3,095
(441)
(12%)
Consumer Services
3,522
3,279
(243)
(7%)
Media and Entertainment
16,205
7,421
(8,784)
(54%)
Consumer Discretionary Distribution Retail
7,437
7,126
(311)
(4%)
Consumer Staples Distribution Retail
5,704
4,989
(715)
(13%)
Food Beverages
4,347
4,209
(138)
(3%)
Household Personal Products
4,568
4,002
(566)
(12%)
Health Care Equipment Services
9,868
8,617
(1,251)
(13%)
Pharma, Biotech Life Science
4,373
4,432
+59
+1%
Financial Services
5,404
4,619
(785)
(15%)
Software Services
58,137
50,810
(7,327)
(13%)
Real Estate Management Development
2,877
2,932
+55
+2%
Insurance
7,447
8,273
+826
+11%
REITs
2,922
2,712
(210)
(7%)
Banks
12,255
12,551
+296
+2%
Telecommunication Services
8,763
8,629
(134)
(2%)
Utilities
7,283
6,771
(512)
(7%)
Market
10,491
10,441
(50)
(0.5%)