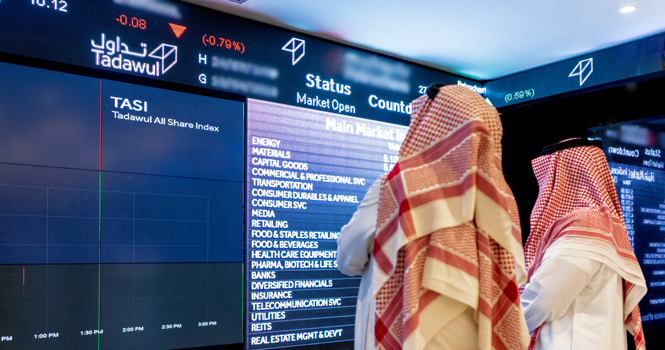
Tadawul trading screen
Shares of 34 TASI-listed companies and units of four REITs fell today, Oct. 22, to their lowest levels since their debut, data compiled by Argaam showed. 
Stocks/Units at All-Time Lows
Company
Closing Price on the 1st Trading Day* (SAR)
Price (SAR)**
YTD Performance
Listing Date
SVCP
187.00
15.50
(92%)
May 2007
Naseej
106.40
10.06
(91%)
Feb. 2010
Gulf General
25.70
3.00
(88%)
Feb. 2010
Salama
48.91
6.51
(87%)
May 2007
Red Sea
85.56
16.40
(81%)
Nov. 2006
Nice one
45.50
9.19
(80%)
Jan. 2025
Northern Cement
30.00
6.20
(79%)
Feb. 2013
Jahez
46.99
9.95
(79%)
Jan. 2022
Lazurde
34.06
7.89
(77%)
June 2016
Musharaka REIT
11.00
3.01
(73%)
Oct. 2017
Entaj
65.00
18.50
(72%)
March 2025
Nayifat
29.38
8.86
(70%)
Nov. 2021
SACO
51.33
15.54
(70%)
May 2015
Al-Majdiah
13.83
5.40
(61%)
Sept. 2025
Jadwa REIT Al Haramain
11.00
4.35
(60%)
April 2017
Build Station
80.80
32.80
(59%)
Sept. 2025
Farm Superstores
22.00
9.34
(58%)
Feb. 2014
SHL
26.00
11.70
(55%)
April 2022
Theeb
33.89
16.68
(51%)
March 2021
Alkhabeer REIT
10.64
5.24
(51%)
March 2019
Amlak
15.64
7.80
(50%)
July 2020
SMC
24.16
12.44
(49%)
June 2025
Herfy
24.46
12.70
(48%)
Feb. 2010
2P
8.59
4.47
(48%)
Nov. 2022
MBC Group
32.50
17.05
(48%)
Jan. 2024
SMASCO
9.05
4.77
(47%)
June 2024
Riyadh Cement
34.80
18.87
(46%)
Sept. 2020
CGS
10.08
5.68
(44%)
Dec. 2025
Miahona
14.94
8.50
(43%)
June 2024
Tamkeen
65.00
38.94
(40%)
Nov. 2024
Amiantit
14.44
9.50
(34%)
May 1996
Saleh Al-Rashed
51.50
34.90
(32%)
March 2026
Cherry
26.40
19.37
(27%)
Dec. 2025
Almoosa
146.00
107.60
(26%)
Jan. 2025
Retal
9.68
7.26
(25%)
June 2022
Jadwa REIT Saudi
9.23
7.83
(15%)
Feb. 2018
Umm Al Qura Cement
11.00
9.74
(11%)
June 2014
Tadawul Group
118.00
106.70
(10%)
Dec. 2021
**The lowest price during the session, but not the current trading price.
Tadawul trading screen
Shares of 34 TASI-listed companies and units of four REITs fell today, Oct. 22, to their lowest levels since their debut, data compiled by Argaam showed.
Stocks/Units at All-Time Lows
Company
Closing Price on the 1st Trading Day* (SAR)
Price (SAR)**
YTD Performance
Listing Date
SVCP
187.00
15.50
(92%)
May 2007
Naseej
106.40
10.06
(91%)
Feb. 2010
Gulf General
25.70
3.00
(88%)
Feb. 2010
Salama
48.91
6.51
(87%)
May 2007
Red Sea
85.56
16.40
(81%)
Nov. 2006
Nice one
45.50
9.19
(80%)
Jan. 2025
Northern Cement
30.00
6.20
(79%)
Feb. 2013
Jahez
46.99
9.95
(79%)
Jan. 2022
Lazurde
34.06
7.89
(77%)
June 2016
Musharaka REIT
11.00
3.01
(73%)
Oct. 2017
Entaj
65.00
18.50
(72%)
March 2025
Nayifat
29.38
8.86
(70%)
Nov. 2021
SACO
51.33
15.54
(70%)
May 2015
Al-Majdiah
13.83
5.40
(61%)
Sept. 2025
Jadwa REIT Al Haramain
11.00
4.35
(60%)
April 2017
Build Station
80.80
32.80
(59%)
Sept. 2025
Farm Superstores
22.00
9.34
(58%)
Feb. 2014
SHL
26.00
11.70
(55%)
April 2022
Theeb
33.89
16.68
(51%)
March 2021
Alkhabeer REIT
10.64
5.24
(51%)
March 2019
Amlak
15.64
7.80
(50%)
July 2020
SMC
24.16
12.44
(49%)
June 2025
Herfy
24.46
12.70
(48%)
Feb. 2010
2P
8.59
4.47
(48%)
Nov. 2022
MBC Group
32.50
17.05
(48%)
Jan. 2024
SMASCO
9.05
4.77
(47%)
June 2024
Riyadh Cement
34.80
18.87
(46%)
Sept. 2020
CGS
10.08
5.68
(44%)
Dec. 2025
Miahona
14.94
8.50
(43%)
June 2024
Tamkeen
65.00
38.94
(40%)
Nov. 2024
Amiantit
14.44
9.50
(34%)
May 1996
Saleh Al-Rashed
51.50
34.90
(32%)
March 2026
Cherry
26.40
19.37
(27%)
Dec. 2025
Almoosa
146.00
107.60
(26%)
Jan. 2025
Retal
9.68
7.26
(25%)
June 2022
Jadwa REIT Saudi
9.23
7.83
(15%)
Feb. 2018
Umm Al Qura Cement
11.00
9.74
(11%)
June 2014
Tadawul Group
118.00
106.70
(10%)
Dec. 2021
**The lowest price during the session, but not the current trading price.