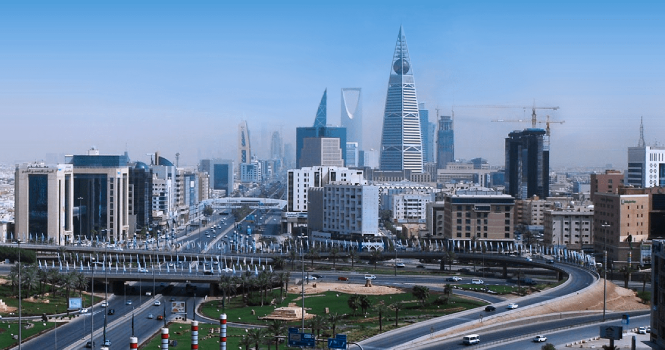
Riyadh city
The value of real estate transactions in the Saudi market declined 17% in September 2026 to around SAR 27.8 billion, compared with around SAR 33.6 billion in September 2025. 
This was due to a 19% year-on-year (YoY) decline in residential transaction value to SAR 14.9 billion from around SAR 18.4 billion in September 2025, in addition to a 15% drop in non-residential transaction value to SAR 12.8 billion, according to data from the Real Estate General Authority (REGA).
Residential transactions accounted for around 54% of total real estate transaction value in September 2026, while non-residential transactions represented around 46%.
Real Estate Transaction Value by Sector (SAR bln)
Sector
Sept. 2025
Sept. 2026
Change
% to Total
Residential
18.41
14.94
(19%)
54%
Non-residential
15.18
12.83
(15%)
46%
Total
33.59
27.76
(17%)
100%
Real Estate Transaction Value by Sector (SAR bln)
Month*
Residential
Non-residential
Total
January 2026
17.52
10.96
28.48
February
14.65
9.39
24.04
March
12.03
7.34
19.37
April
18.07
11.24
29.31
May
14.14
8.47
22.61
June
15.02
8.65
23.67
July
19.82
15.72
35.54
August
17.90
6.51
24.41
September
14.94
12.83
27.76
The number of real estate transactions executed in September 2026 fell to around 22,000, down 13%, with residential and non-residential transactions declining 13% each.
Number of Real Estate Transactions by Sector
Sector
September 2025
September 2026
Change
Residential
22794
19911
(13%)
Non-residential
2402
2080
(13%)
Total
25196
21991
(13%)
Land accounted for the largest share of residential transaction value in September 2026 at SAR 6.4 billion, or around 43% of total residential transaction value, followed by apartments at SAR 2.9 billion and villas at SAR 2.6 billion.
Land transactions value was the biggest decliner, down 32%, followed by Duplex at 31%.
Residential Transaction Value by Property Type (SAR bln)
Type
September 2025
September 2026
Change
Land
9.48
6.42
(32%)
Apartment
3.64
2.89
(21%)
Villa
2.78
2.65
(5%)
Floor
0.65
0.92
42%
Duplex
1.28
0.88
(31%)
Other
0.59
1.19
102%
Total
18.41
14.94
(19%)
Data showed that the number of residential real estate transactions declined YoY across most property types in September 2026, except for villas and floors, which rose 73% and 12% YoY, respectively.
Number of Residential Transactions by Property Type
Type
September 2025
September 2026
Change
Land
13186
10219
(23%)
Apartment
5423
4698
(13%)
Villa
1756
1965
12%
Floor
697
1207
73%
Duplex
1098
751
(32%)
Other
634
1071
69%
Total
22794
19911
(13%)
According to the data, real estate liquidity was concentrated in the major regions, with Makkah accounting for 38% of total transaction value, followed by Riyadh at 33% and the Eastern Province at 17%.
Top Administrative Regions by Real Estate Transaction Value
Province
Value (SAR bln)
Share
Makkah
10.47
37.7%
Riyadh
9.06
32.6%
Eastern Province
4.72
17.0%
Madinah
1.32
4.7%
Qassim
0.52
1.9%
Riyadh led real estate market activity by transaction volume, accounting for 29% of the total number of transactions executed in the Kingdom, followed by Makkah at 21% and the Eastern Province at 15%.
Top Administrative Regions by Number of Real Estate Transactions
Province
Number of Transactions
Share
Riyadh
6447
29.0%
Makkah
4667
21.0%
Eastern Province
3362
15.0%
Qassim
1747
8.0%
Madinah
1204
5.0%
Rental transaction value up 18% to SAR 9.4B
Rental transaction value rose 18% YoY to SAR 9.4 billion in September 2026, compared with around SAR 7.9 billion in the same month a year earlier.
This was driven by a 19% increase in the value of residential rental transactions to around SAR 5.3 billion, compared with SAR 4.5 billion in September 2025, accounting for 56% of total rental transactions.
Number of Rental Transactions by Sector
Sector
September 2025
September 2026
Change
Residential
4.45
5.30
19%
Non-residential
3.49
4.09
17%
Total
7.94
9.39
18%
The number of rental contracts in the Kingdom increased 37% YoY in September 2026 to 413,800, compared to 301,700 transactions in the same period a year ago.
Residential rentals increased by 36%, compared to a 40% rise for the non-residential sector.
Number of Rental Transactions by Sector
Sector
September 2025
September 2026
Change
Residential
230973
314985
36%
Non-residential
70735
98850
40%
Total
301708
413835
37%
The number of rental contracts in Saudi Arabia rose 36% YoY in September 2026 to 353,100, driven by growth in both residential and non-residential leases.
Residential rental contracts increased 36% YoY to 284,300, while non-residential rental contracts grew by 38% to 68,800.
Number of Rental Contracts by Sector
Sector
September 2025
September 2026
Change
Residential
209482
284272
36%
Non-residential
49791
68817
38%
Total
259273
353089
36%
Riyadh ranked first among administrative regions by rental transaction value at SAR 3.9 billion, followed by Makkah at SAR 2.4 billion.
Top Administrative Regions by Rental Transaction Value
Province
Value (SAR bln)
Share
Riyadh
3.90
42%
Makkah
2.43
26%
Eastern Province
1.38
15%
Madinah
0.44
5%
Asir
0.31
3%
Riyadh also ranked first among administrative regions by number of rental transactions, recording 133,800 transactions, representing 32% of the Kingdom’s total.
Makkah ranked second with 107,100 transactions and a 26% share, followed by the Eastern Province with 65,700 transactions, representing 16%.
Top Administrative Regions by Number of Rental Transactions
Province
Transactions
Share
Riyadh
133835
32%
Makkah
107101
26%
Eastern Province
65737
16%
Madinah
23069
6%
Asir
19854
5%
Riyadh city
The value of real estate transactions in the Saudi market declined 17% in September 2026 to around SAR 27.8 billion, compared with around SAR 33.6 billion in September 2025.
This was due to a 19% year-on-year (YoY) decline in residential transaction value to SAR 14.9 billion from around SAR 18.4 billion in September 2025, in addition to a 15% drop in non-residential transaction value to SAR 12.8 billion, according to data from the Real Estate General Authority (REGA).
Residential transactions accounted for around 54% of total real estate transaction value in September 2026, while non-residential transactions represented around 46%.
Real Estate Transaction Value by Sector (SAR bln)
Sector
Sept. 2025
Sept. 2026
Change
% to Total
Residential
18.41
14.94
(19%)
54%
Non-residential
15.18
12.83
(15%)
46%
Total
33.59
27.76
(17%)
100%
Real Estate Transaction Value by Sector (SAR bln)
Month*
Residential
Non-residential
Total
January 2026
17.52
10.96
28.48
February
14.65
9.39
24.04
March
12.03
7.34
19.37
April
18.07
11.24
29.31
May
14.14
8.47
22.61
June
15.02
8.65
23.67
July
19.82
15.72
35.54
August
17.90
6.51
24.41
September
14.94
12.83
27.76
The number of real estate transactions executed in September 2026 fell to around 22,000, down 13%, with residential and non-residential transactions declining 13% each.
Number of Real Estate Transactions by Sector
Sector
September 2025
September 2026
Change
Residential
22794
19911
(13%)
Non-residential
2402
2080
(13%)
Total
25196
21991
(13%)
Land accounted for the largest share of residential transaction value in September 2026 at SAR 6.4 billion, or around 43% of total residential transaction value, followed by apartments at SAR 2.9 billion and villas at SAR 2.6 billion.
Land transactions value was the biggest decliner, down 32%, followed by Duplex at 31%.
Residential Transaction Value by Property Type (SAR bln)
Type
September 2025
September 2026
Change
Land
9.48
6.42
(32%)
Apartment
3.64
2.89
(21%)
Villa
2.78
2.65
(5%)
Floor
0.65
0.92
42%
Duplex
1.28
0.88
(31%)
Other
0.59
1.19
102%
Total
18.41
14.94
(19%)
Data showed that the number of residential real estate transactions declined YoY across most property types in September 2026, except for villas and floors, which rose 73% and 12% YoY, respectively.
Number of Residential Transactions by Property Type
Type
September 2025
September 2026
Change
Land
13186
10219
(23%)
Apartment
5423
4698
(13%)
Villa
1756
1965
12%
Floor
697
1207
73%
Duplex
1098
751
(32%)
Other
634
1071
69%
Total
22794
19911
(13%)
According to the data, real estate liquidity was concentrated in the major regions, with Makkah accounting for 38% of total transaction value, followed by Riyadh at 33% and the Eastern Province at 17%.
Top Administrative Regions by Real Estate Transaction Value
Province
Value (SAR bln)
Share
Makkah
10.47
37.7%
Riyadh
9.06
32.6%
Eastern Province
4.72
17.0%
Madinah
1.32
4.7%
Qassim
0.52
1.9%
Riyadh led real estate market activity by transaction volume, accounting for 29% of the total number of transactions executed in the Kingdom, followed by Makkah at 21% and the Eastern Province at 15%.
Top Administrative Regions by Number of Real Estate Transactions
Province
Number of Transactions
Share
Riyadh
6447
29.0%
Makkah
4667
21.0%
Eastern Province
3362
15.0%
Qassim
1747
8.0%
Madinah
1204
5.0%
Rental transaction value up 18% to SAR 9.4B
Rental transaction value rose 18% YoY to SAR 9.4 billion in September 2026, compared with around SAR 7.9 billion in the same month a year earlier.
This was driven by a 19% increase in the value of residential rental transactions to around SAR 5.3 billion, compared with SAR 4.5 billion in September 2025, accounting for 56% of total rental transactions.
Number of Rental Transactions by Sector
Sector
September 2025
September 2026
Change
Residential
4.45
5.30
19%
Non-residential
3.49
4.09
17%
Total
7.94
9.39
18%
The number of rental contracts in the Kingdom increased 37% YoY in September 2026 to 413,800, compared to 301,700 transactions in the same period a year ago.
Residential rentals increased by 36%, compared to a 40% rise for the non-residential sector.
Number of Rental Transactions by Sector
Sector
September 2025
September 2026
Change
Residential
230973
314985
36%
Non-residential
70735
98850
40%
Total
301708
413835
37%
The number of rental contracts in Saudi Arabia rose 36% YoY in September 2026 to 353,100, driven by growth in both residential and non-residential leases.
Residential rental contracts increased 36% YoY to 284,300, while non-residential rental contracts grew by 38% to 68,800.
Number of Rental Contracts by Sector
Sector
September 2025
September 2026
Change
Residential
209482
284272
36%
Non-residential
49791
68817
38%
Total
259273
353089
36%
Riyadh ranked first among administrative regions by rental transaction value at SAR 3.9 billion, followed by Makkah at SAR 2.4 billion.
Top Administrative Regions by Rental Transaction Value
Province
Value (SAR bln)
Share
Riyadh
3.90
42%
Makkah
2.43
26%
Eastern Province
1.38
15%
Madinah
0.44
5%
Asir
0.31
3%
Riyadh also ranked first among administrative regions by number of rental transactions, recording 133,800 transactions, representing 32% of the Kingdom’s total.
Makkah ranked second with 107,100 transactions and a 26% share, followed by the Eastern Province with 65,700 transactions, representing 16%.
Top Administrative Regions by Number of Rental Transactions
Province
Transactions
Share
Riyadh
133835
32%
Makkah
107101
26%
Eastern Province
65737
16%
Madinah
23069
6%
Asir
19854
5%