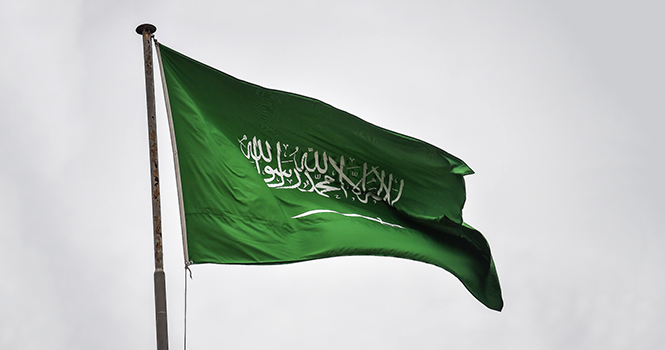
The Kingdom of Saudi Arabia’s flag
The seasonally adjusted Riyad Bank Saudi Arabia Purchasing Managers’ Index (PMI), formerly SP Global Saudi Arabia PMI, rose to 55.3 points in September. 
The index pointed to an improvement in business conditions in the non-oil private sector for the sixth consecutive month, with the pace of improvement the strongest since February. However, the acceleration was largely driven by a notable increase in new orders, masking a simultaneous slowdown in output growth.
This came amid a sixth consecutive month of improvement in operating conditions across the non-oil private sector and marked the strongest rate of expansion since February. While the acceleration was largely driven by a sharp rebound in new orders, the headline index masked a concurrent slowdown in output growth.
Saudi Arabia’s non-oil private sector maintained its growth trajectory in September, supported by recovering demand levels, alongside faster hiring and purchasing activity. However, gains were uneven; while new order growth hit a seven-month high, business activity growth eased to a five-month low, and corporate sentiment weakened amid heightened concerns over regional tensions and persistent supply chain bottlenecks.
Moreover, demand continued to be driven by domestic sales, while new orders from foreign clients fell for the seventh consecutive month. On the inputs front, companies reported sharp increases in material and freight costs, resulting in a significant rise in selling prices.
The new orders index, on the other hand, rose sharply in September and was much closer to its long-run average, indicating that demand conditions had recovered well after slowing in mid-2026. Companies’ comments in the latest survey indicated that the gradual improvement in market conditions led to an increase in customer numbers and higher spending.
However, the recovery was primarily driven by the domestic market. Although the pace of decline slowed significantly in September, new orders from foreign clients fell for seven consecutive months, with companies highlighting the negative impact of supply chain disruptions.
Saudi PMI since 2023*
Month
Index (points)
Change (points)
Change (%)
January 2023
58.2
+ 1.3
+ 2.3 %
February
59.8
+ 1.6
+ 2.7 %
March
58.7
(1.1)
(1.8%)
April
59.6
+ 0.9
+ 1.5 %
May
58.5
(1.1)
(1.8%)
June
59.6
+ 1.1
+ 1.9 %
July
57.7
(1.9)
(3.2%)
August
56.6
(1.1)
(1.9%)
September
57.2
+ 0.6
+ 1.1 %
October
58.4
+ 1.2
+ 2.1 %
November
57.5
(0.9)
(1.5%)
December
57.5
—
—
January 2024
55.4
(2.1)
(3.7%)
February
57.2
+ 1.8
+ 3.2 %
March
57.0
(0.2)
(0.3%)
April
57.0
—
—
May
56.4
(0.6)
(1.1%)
June
55.0
(1.4)
(2.5%)
July
54.4
(0.6)
(1.1%)
August
54.8
+ 0.4
+ 0.7 %
September
56.3
+ 1.5
+ 2.7 %
October
56.9
+ 0.6
+ 1.1 %
November
59.0
+ 2.1
+ 3.7 %
December
58.4
(0.6)
(1.0%)
January 2025
60.5
+ 2.1
+ 3.6 %
February
58.4
(2.1)
(3.5%)
March
58.1
(0.3)
(0.5%)
April
55.6
(2.5)
(4.3%)
May
55.8
+ 0.2
+ 0.4 %
June
57.2
+ 1.4
+ 2.5 %
July
56.3
(0.9)
(1.6%)
August
56.4
+ 0.1
+0.2%
September
57.8
+ 1.4
+ 2.5 %
October
60.2
+ 2.4
+ 4.2 %
November
58.5
(1.7)
(2.8%)
December
57.4
(1.1)
(1.9%)
January 2026
56.3
(1.1)
(1.9%)
February
56.1
(0.2)
(0.4%)
March
48.8
(7.3)
(13%)
April
51.5
+ 2.7
+ 5.5 %
May
52.8
+ 1.3
+ 2.5 %
June
53.3
+ 0.5
+ 0.9 %
July
53.1
(0.2)
(0.4%)
August
53.8
+ 0.7
+ 1.3 %
September
55.3
+ 1.5
+ 2.8 %
*Change on a monthly basis.
Riyad Bank PMI Components
Sub-index
Weight
New orders
30%
Output
25%
Employment
20%
Suppliers’ delivery times
15%
Inventories
10%
Total
100%
The Kingdom of Saudi Arabia’s flag
The seasonally adjusted Riyad Bank Saudi Arabia Purchasing Managers’ Index (PMI), formerly SP Global Saudi Arabia PMI, rose to 55.3 points in September.
The index pointed to an improvement in business conditions in the non-oil private sector for the sixth consecutive month, with the pace of improvement the strongest since February. However, the acceleration was largely driven by a notable increase in new orders, masking a simultaneous slowdown in output growth.
This came amid a sixth consecutive month of improvement in operating conditions across the non-oil private sector and marked the strongest rate of expansion since February. While the acceleration was largely driven by a sharp rebound in new orders, the headline index masked a concurrent slowdown in output growth.
Saudi Arabia’s non-oil private sector maintained its growth trajectory in September, supported by recovering demand levels, alongside faster hiring and purchasing activity. However, gains were uneven; while new order growth hit a seven-month high, business activity growth eased to a five-month low, and corporate sentiment weakened amid heightened concerns over regional tensions and persistent supply chain bottlenecks.
Moreover, demand continued to be driven by domestic sales, while new orders from foreign clients fell for the seventh consecutive month. On the inputs front, companies reported sharp increases in material and freight costs, resulting in a significant rise in selling prices.
The new orders index, on the other hand, rose sharply in September and was much closer to its long-run average, indicating that demand conditions had recovered well after slowing in mid-2026. Companies’ comments in the latest survey indicated that the gradual improvement in market conditions led to an increase in customer numbers and higher spending.
However, the recovery was primarily driven by the domestic market. Although the pace of decline slowed significantly in September, new orders from foreign clients fell for seven consecutive months, with companies highlighting the negative impact of supply chain disruptions.
Saudi PMI since 2023*
Month
Index (points)
Change (points)
Change (%)
January 2023
58.2
+ 1.3
+ 2.3 %
February
59.8
+ 1.6
+ 2.7 %
March
58.7
(1.1)
(1.8%)
April
59.6
+ 0.9
+ 1.5 %
May
58.5
(1.1)
(1.8%)
June
59.6
+ 1.1
+ 1.9 %
July
57.7
(1.9)
(3.2%)
August
56.6
(1.1)
(1.9%)
September
57.2
+ 0.6
+ 1.1 %
October
58.4
+ 1.2
+ 2.1 %
November
57.5
(0.9)
(1.5%)
December
57.5
—
—
January 2024
55.4
(2.1)
(3.7%)
February
57.2
+ 1.8
+ 3.2 %
March
57.0
(0.2)
(0.3%)
April
57.0
—
—
May
56.4
(0.6)
(1.1%)
June
55.0
(1.4)
(2.5%)
July
54.4
(0.6)
(1.1%)
August
54.8
+ 0.4
+ 0.7 %
September
56.3
+ 1.5
+ 2.7 %
October
56.9
+ 0.6
+ 1.1 %
November
59.0
+ 2.1
+ 3.7 %
December
58.4
(0.6)
(1.0%)
January 2025
60.5
+ 2.1
+ 3.6 %
February
58.4
(2.1)
(3.5%)
March
58.1
(0.3)
(0.5%)
April
55.6
(2.5)
(4.3%)
May
55.8
+ 0.2
+ 0.4 %
June
57.2
+ 1.4
+ 2.5 %
July
56.3
(0.9)
(1.6%)
August
56.4
+ 0.1
+0.2%
September
57.8
+ 1.4
+ 2.5 %
October
60.2
+ 2.4
+ 4.2 %
November
58.5
(1.7)
(2.8%)
December
57.4
(1.1)
(1.9%)
January 2026
56.3
(1.1)
(1.9%)
February
56.1
(0.2)
(0.4%)
March
48.8
(7.3)
(13%)
April
51.5
+ 2.7
+ 5.5 %
May
52.8
+ 1.3
+ 2.5 %
June
53.3
+ 0.5
+ 0.9 %
July
53.1
(0.2)
(0.4%)
August
53.8
+ 0.7
+ 1.3 %
September
55.3
+ 1.5
+ 2.8 %
*Change on a monthly basis.
Riyad Bank PMI Components
Sub-index
Weight
New orders
30%
Output
25%
Employment
20%
Suppliers’ delivery times
15%
Inventories
10%
Total
100%