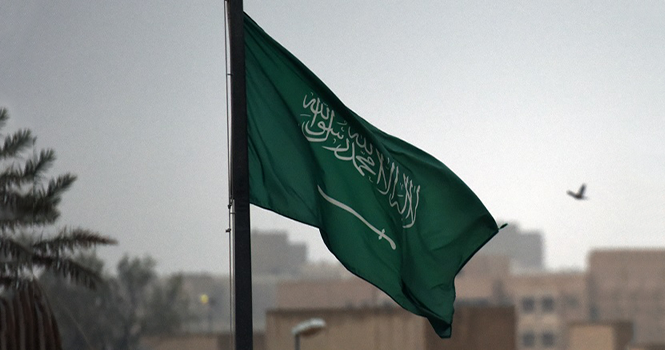
The Kingdom of Saudi Arabia’s flag
Credit facilities extended to micro, small, and medium enterprises (MSMEs) by banks and financing companies in Saudi Arabia rose 17% year-on-year (YoY) to SAR 490.8 billion by the end of Q2 2026. 
Banks accounted for SAR 467.6 billion, or approximately 95% of the total, while financing companies provided SAR 23.2 billion, according to Saudi Central Bank (SAMA) data.
In Saudi Arabia, medium-sized enterprises are classified as those with annual revenues of SAR 40 million to SAR 200 million or between 50 and 249 employees. Small enterprises generate annual revenues of SAR 3 million to SAR 40 million or employ between 6 and 49 people. Micro enterprises generate annual revenues of less than SAR 3 million and employ fewer than five people.
Credit Facilities to MSMEs by Financing Provider (SAR bln)*
Period
Banking Sector
Financing Institutions
Total
YoY Change
Q1 2021
175.46
12.97
188.43
+40%
Q2
184.76
13.46
198.22
+25%
Q3
186.22
14.16
200.37
+14%
Q4
188.59
14.64
203.23
+12%
Q1 2022
203.41
15.27
218.68
+16%
Q2
205.61
15.39
221.00
+11%
Q3
212.57
15.47
228.03
+14%
Q4
213.23
16.08
229.30
+13%
Q1 2023
234.95
17.28
252.23
+15%
Q2
245.34
17.31
262.66
+19%
Q3
251.64
16.93
268.57
+18%
Q4
258.30
17.28
275.58
+20%
Q1 2024
275.73
17.70
293.43
+16%
Q2
289.80
17.61
307.40
+17%
Q3
311.77
17.46
329.23
+23%
Q4
333.50
18.22
351.72
+28%
Q1 2025
364.50
18.84
383.34
+31%
Q2
402.14
19.10
421.25
+37%
Q3
427.68
19.23
446.91
+36%
Q4
446.65
21.93
468.57
+33%
Q1 2026
466.66
22.53
489.19
+28%
Q2
467.60
23.20
490.80
+17%
According to the data, medium-sized enterprises accounted for the largest share of total credit facilities at approximately SAR 231.8 billion, representing 47% of the total. Small enterprises followed with SAR 172.2 billion, while microenterprises received SAR 86.8 billion.
Credit Facilities to MSMEs (SAR bln)
Enterprise
Value
% of Total
Medium
231.79
47%
Small
172.25
35%
Micro
86.76
18%
Total
490.80
100%
Medium-sized enterprises accounted for 48% of total credit facilities extended by the banking sector by the end of Q2 2026, equivalent to SAR 222.2 billion. Small enterprises received SAR 162.7 billion, while facilities extended to microenterprises stood at approximately SAR 82.7 billion, as shown in the following table:
Credit Facilities by Banks (SAR bln)
Period
Micro
Small
Medium
Total
Q1 2021
8.34
39.67
127.45
175.46
Q2
8.47
44.18
132.11
184.76
Q3
11.14
45.08
129.99
186.22
Q4
9.37
50.59
128.64
188.59
Q1 2022
13.83
54.04
135.54
203.41
Q2
14.94
55.78
134.88
205.61
Q3
14.37
61.55
136.64
212.57
Q4
15.18
65.08
132.97
213.23
Q1 2023
19.62
70.25
145.09
234.95
Q2
20.21
75.70
149.43
245.34
Q3
21.35
77.87
152.42
251.64
Q4
22.32
84.09
151.89
258.30
Q1 2024
26.80
95.19
153.74
275.73
Q2
31.13
98.26
160.41
289.80
Q3
33.50
104.15
174.12
311.77
Q4
39.60
113.98
179.93
333.50
Q1 2025
50.76
131.15
182.59
364.50
Q2
57.40
145.78
198.96
402.14
Q3
62.99
152.87
211.81
427.68
Q4
80.07
154.42
212.16
446.65
Q1 2026
85.55
160.37
220.75
466.66
Q2
82.74
162.69
222.18
467.60
Medium-sized enterprises received SAR 9.62 billion of the total credit facilities extended by financing companies in Q2 2026. Small enterprises accounted for approximately SAR 9.56 billion, while microenterprises received around SAR 4.02 billion, as shown in the following table:
Credit Facilities by Financing Companies (SAR bln)
Period
Micro
Small
Medium
Total
Q1 2021
2.79
5.63
4.55
12.97
Q2
2.70
6.10
4.66
13.46
Q3
2.77
6.61
4.78
14.16
Q4
2.94
6.77
4.93
14.64
Q1 2022
3.15
7.22
4.90
15.27
Q2
3.17
7.26
4.97
15.39
Q3
3.42
7.17
4.87
15.47
Q4
3.20
7.54
5.34
16.08
Q1 2023
2.92
8.30
6.06
17.28
Q2
2.95
8.18
6.19
17.31
Q3
2.68
8.04
6.21
16.93
Q4
2.58
8.19
6.52
17.28
Q1 2024
2.59
8.26
6.85
17.70
Q2
2.57
8.14
6.90
17.61
Q3
2.64
7.88
6.93
17.46
Q4
2.59
8.27
7.36
18.22
Q1 2025
2.75
8.46
7.62
18.84
Q2
2.71
8.53
7.87
19.10
Q3
2.65
8.72
7.86
19.23
Q4
3.22
9.35
9.36
21.93
Q1 2026
3.54
9.38
9.61
22.53
Q2
4.02
9.56
9.62
23.20
The Kingdom of Saudi Arabia’s flag
Credit facilities extended to micro, small, and medium enterprises (MSMEs) by banks and financing companies in Saudi Arabia rose 17% year-on-year (YoY) to SAR 490.8 billion by the end of Q2 2026.
Banks accounted for SAR 467.6 billion, or approximately 95% of the total, while financing companies provided SAR 23.2 billion, according to Saudi Central Bank (SAMA) data.
In Saudi Arabia, medium-sized enterprises are classified as those with annual revenues of SAR 40 million to SAR 200 million or between 50 and 249 employees. Small enterprises generate annual revenues of SAR 3 million to SAR 40 million or employ between 6 and 49 people. Micro enterprises generate annual revenues of less than SAR 3 million and employ fewer than five people.
Credit Facilities to MSMEs by Financing Provider (SAR bln)*
Period
Banking Sector
Financing Institutions
Total
YoY Change
Q1 2021
175.46
12.97
188.43
+40%
Q2
184.76
13.46
198.22
+25%
Q3
186.22
14.16
200.37
+14%
Q4
188.59
14.64
203.23
+12%
Q1 2022
203.41
15.27
218.68
+16%
Q2
205.61
15.39
221.00
+11%
Q3
212.57
15.47
228.03
+14%
Q4
213.23
16.08
229.30
+13%
Q1 2023
234.95
17.28
252.23
+15%
Q2
245.34
17.31
262.66
+19%
Q3
251.64
16.93
268.57
+18%
Q4
258.30
17.28
275.58
+20%
Q1 2024
275.73
17.70
293.43
+16%
Q2
289.80
17.61
307.40
+17%
Q3
311.77
17.46
329.23
+23%
Q4
333.50
18.22
351.72
+28%
Q1 2025
364.50
18.84
383.34
+31%
Q2
402.14
19.10
421.25
+37%
Q3
427.68
19.23
446.91
+36%
Q4
446.65
21.93
468.57
+33%
Q1 2026
466.66
22.53
489.19
+28%
Q2
467.60
23.20
490.80
+17%
According to the data, medium-sized enterprises accounted for the largest share of total credit facilities at approximately SAR 231.8 billion, representing 47% of the total. Small enterprises followed with SAR 172.2 billion, while microenterprises received SAR 86.8 billion.
Credit Facilities to MSMEs (SAR bln)
Enterprise
Value
% of Total
Medium
231.79
47%
Small
172.25
35%
Micro
86.76
18%
Total
490.80
100%
Medium-sized enterprises accounted for 48% of total credit facilities extended by the banking sector by the end of Q2 2026, equivalent to SAR 222.2 billion. Small enterprises received SAR 162.7 billion, while facilities extended to microenterprises stood at approximately SAR 82.7 billion, as shown in the following table:
Credit Facilities by Banks (SAR bln)
Period
Micro
Small
Medium
Total
Q1 2021
8.34
39.67
127.45
175.46
Q2
8.47
44.18
132.11
184.76
Q3
11.14
45.08
129.99
186.22
Q4
9.37
50.59
128.64
188.59
Q1 2022
13.83
54.04
135.54
203.41
Q2
14.94
55.78
134.88
205.61
Q3
14.37
61.55
136.64
212.57
Q4
15.18
65.08
132.97
213.23
Q1 2023
19.62
70.25
145.09
234.95
Q2
20.21
75.70
149.43
245.34
Q3
21.35
77.87
152.42
251.64
Q4
22.32
84.09
151.89
258.30
Q1 2024
26.80
95.19
153.74
275.73
Q2
31.13
98.26
160.41
289.80
Q3
33.50
104.15
174.12
311.77
Q4
39.60
113.98
179.93
333.50
Q1 2025
50.76
131.15
182.59
364.50
Q2
57.40
145.78
198.96
402.14
Q3
62.99
152.87
211.81
427.68
Q4
80.07
154.42
212.16
446.65
Q1 2026
85.55
160.37
220.75
466.66
Q2
82.74
162.69
222.18
467.60
Medium-sized enterprises received SAR 9.62 billion of the total credit facilities extended by financing companies in Q2 2026. Small enterprises accounted for approximately SAR 9.56 billion, while microenterprises received around SAR 4.02 billion, as shown in the following table:
Credit Facilities by Financing Companies (SAR bln)
Period
Micro
Small
Medium
Total
Q1 2021
2.79
5.63
4.55
12.97
Q2
2.70
6.10
4.66
13.46
Q3
2.77
6.61
4.78
14.16
Q4
2.94
6.77
4.93
14.64
Q1 2022
3.15
7.22
4.90
15.27
Q2
3.17
7.26
4.97
15.39
Q3
3.42
7.17
4.87
15.47
Q4
3.20
7.54
5.34
16.08
Q1 2023
2.92
8.30
6.06
17.28
Q2
2.95
8.18
6.19
17.31
Q3
2.68
8.04
6.21
16.93
Q4
2.58
8.19
6.52
17.28
Q1 2024
2.59
8.26
6.85
17.70
Q2
2.57
8.14
6.90
17.61
Q3
2.64
7.88
6.93
17.46
Q4
2.59
8.27
7.36
18.22
Q1 2025
2.75
8.46
7.62
18.84
Q2
2.71
8.53
7.87
19.10
Q3
2.65
8.72
7.86
19.23
Q4
3.22
9.35
9.36
21.93
Q1 2026
3.54
9.38
9.61
22.53
Q2
4.02
9.56
9.62
23.20