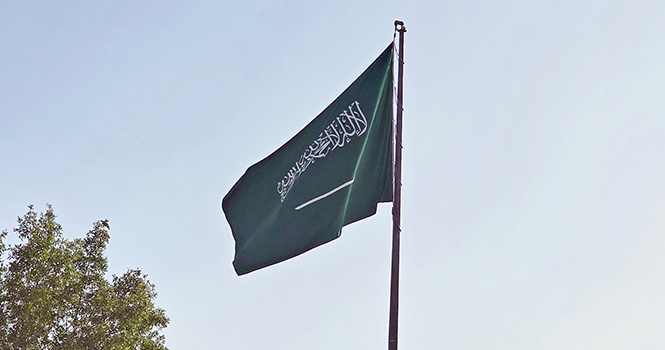
The Kingdom of Saudi Arabia’s flag
The seasonally adjusted Riyad Bank Saudi Arabia Purchasing Managers’ Index (PMI), formerly SP Global Saudi Arabia PMI, rose to 53.8 points in August. 
The reading pointed to a notable improvement in business conditions across the non-oil private sector. It was the highest in six months and signaled expansion for a fifth consecutive month, although it remained below the survey’s long-term average of 56.8 points.
The recovery was driven by a notable increase in output as companies benefited from stronger demand and a continued recovery in market activity. However, external conditions remained challenging, with new export orders falling again amid regional tensions, while persistent cost pressures weighed on companies’ ability to protect profit margins.
Business activity increased notably in August, with the rate of expansion reaching a seven-month high and approaching its long-term average.
According to panel reports, growth was underpinned by improved sales volumes and a recovery in market conditions.
New orders expanded for the fifth consecutive month following a slight decline in March. However, the picture remained mixed, as some companies reported sales challenges due to intense competition and excess supply.
Export conditions also remained difficult, with new international orders falling sharply and at a faster pace than in July.
Saudi PMI since the beginning of 2023*
Month
Index (points)
Change (points)
Change (%)
January 2023
58.2
+1.3
+2.3%
February
59.8
+1.6
+2.7%
March
58.7
(1.1)
(1.8%)
April
59.6
+0.9
+1.5%
May
58.5
(1.1)
(1.8%)
June
59.6
+1.1
+1.9%
July
57.7
(1.9)
(3.2%)
August
56.6
(1.1)
(1.9%)
September
57.2
+0.6
+1.1%
October
58.4
+1.2
+2.1%
November
57.5
(0.9)
(1.5%)
December
57.5
—
—
January 2024
55.4
(2.1)
(3.7%)
February
57.2
+1.8
+3.2%
March
57.0
(0.2)
(0.3%)
April
57.0
—
—
May
56.4
(0.6)
(1.1%)
June
55.0
(1.4)
(2.5%)
July
54.4
(0.6)
(1.1%)
August
54.8
+0.4
+0.7%
September
56.3
+1.5
+2.7%
October
56.9
+0.6
+1.1%
November
59.0
+2.1
+3.7%
December
58.4
(0.6)
(1.0%)
January 2025
60.5
+2.1
+3.6%
February
58.4
(2.1)
(3.5%)
March
58.1
(0.3)
(0.5%)
April
55.6
(2.5)
(4.3%)
May
55.8
+0.2
+0.4%
June
57.2
+1.4
+2.5%
July
56.3
(0.9)
(1.6%)
August
56.4
+0.1
(0.2%)
September
57.8
+1.4
+2.5%
October
60.2
+2.4
+4.2%
November
58.5
(1.7)
(2.8%)
December
57.4
(1.1)
(1.9%)
January 2026
56.3
(1.1)
(1.9%)
February
56.1
(0.2)
(0.4%)
March
48.8
(7.3)
(13.0%)
April
51.5
+2.7
+5.5%
May
52.8
+1.3
+2.5%
June
53.3
+0.5
+0.9%
July
53.1
(0.2)
(0.4%)
August
53.8
+0.7
+1.3%
*Change on a monthly basis.
The Riyad Bank PMI is a weighted average of the following five sub-indices:
Riyad Bank PMI Components
Sub-index
Weight
New orders
30%
Output
25%
Employment
20%
Suppliers’ delivery times
15%
Stocks of purchases
10%
Total
100%
The Kingdom of Saudi Arabia’s flag
The seasonally adjusted Riyad Bank Saudi Arabia Purchasing Managers’ Index (PMI), formerly SP Global Saudi Arabia PMI, rose to 53.8 points in August.
The reading pointed to a notable improvement in business conditions across the non-oil private sector. It was the highest in six months and signaled expansion for a fifth consecutive month, although it remained below the survey’s long-term average of 56.8 points.
The recovery was driven by a notable increase in output as companies benefited from stronger demand and a continued recovery in market activity. However, external conditions remained challenging, with new export orders falling again amid regional tensions, while persistent cost pressures weighed on companies’ ability to protect profit margins.
Business activity increased notably in August, with the rate of expansion reaching a seven-month high and approaching its long-term average.
According to panel reports, growth was underpinned by improved sales volumes and a recovery in market conditions.
New orders expanded for the fifth consecutive month following a slight decline in March. However, the picture remained mixed, as some companies reported sales challenges due to intense competition and excess supply.
Export conditions also remained difficult, with new international orders falling sharply and at a faster pace than in July.
Saudi PMI since the beginning of 2023*
Month
Index (points)
Change (points)
Change (%)
January 2023
58.2
+1.3
+2.3%
February
59.8
+1.6
+2.7%
March
58.7
(1.1)
(1.8%)
April
59.6
+0.9
+1.5%
May
58.5
(1.1)
(1.8%)
June
59.6
+1.1
+1.9%
July
57.7
(1.9)
(3.2%)
August
56.6
(1.1)
(1.9%)
September
57.2
+0.6
+1.1%
October
58.4
+1.2
+2.1%
November
57.5
(0.9)
(1.5%)
December
57.5
—
—
January 2024
55.4
(2.1)
(3.7%)
February
57.2
+1.8
+3.2%
March
57.0
(0.2)
(0.3%)
April
57.0
—
—
May
56.4
(0.6)
(1.1%)
June
55.0
(1.4)
(2.5%)
July
54.4
(0.6)
(1.1%)
August
54.8
+0.4
+0.7%
September
56.3
+1.5
+2.7%
October
56.9
+0.6
+1.1%
November
59.0
+2.1
+3.7%
December
58.4
(0.6)
(1.0%)
January 2025
60.5
+2.1
+3.6%
February
58.4
(2.1)
(3.5%)
March
58.1
(0.3)
(0.5%)
April
55.6
(2.5)
(4.3%)
May
55.8
+0.2
+0.4%
June
57.2
+1.4
+2.5%
July
56.3
(0.9)
(1.6%)
August
56.4
+0.1
(0.2%)
September
57.8
+1.4
+2.5%
October
60.2
+2.4
+4.2%
November
58.5
(1.7)
(2.8%)
December
57.4
(1.1)
(1.9%)
January 2026
56.3
(1.1)
(1.9%)
February
56.1
(0.2)
(0.4%)
March
48.8
(7.3)
(13.0%)
April
51.5
+2.7
+5.5%
May
52.8
+1.3
+2.5%
June
53.3
+0.5
+0.9%
July
53.1
(0.2)
(0.4%)
August
53.8
+0.7
+1.3%
*Change on a monthly basis.
The Riyad Bank PMI is a weighted average of the following five sub-indices:
Riyad Bank PMI Components
Sub-index
Weight
New orders
30%
Output
25%
Employment
20%
Suppliers’ delivery times
15%
Stocks of purchases
10%
Total
100%