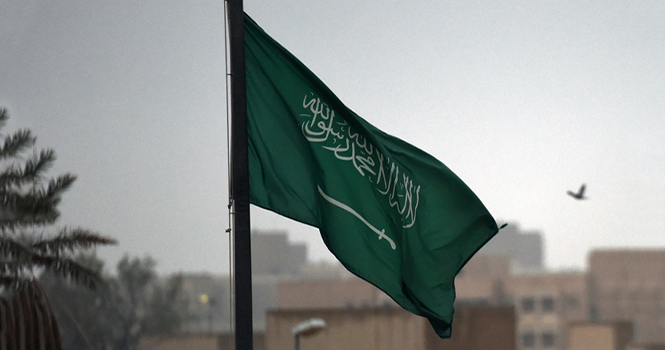
The Kingdom of Saudi Arabia’s flag
Credit facilities extended to micro, small, and medium enterprises (MSMEs) grew 28% year-on-year (YoY) to SAR 489.2 billion in Q1 2026, data from the Saudi Central Bank (SAMA) showed. 
The financing offered by the banking sector reached SAR 466.7 billion, representing 95% of the total facilities. Meanwhile, the financing institutions offered SAR 22.5 billion.
In Saudi Arabia, medium-sized enterprises are classified as those with annual revenues between SAR 40 million and SAR 200 million or employing 50 to 249 on rolls. Small enterprises are those generating annual revenues between SAR 3 million and SAR 40 million and employing between 6 and 49 people. Micro enterprises generate annual revenues of less than SAR 3 million and have less than five employees.
Credit Facilities by Sector (SAR bln)*
Period
Banking sector
Financing Institutions
Total
YoY Change
Q1 2021
175.46
12.97
188.43
+40%
Q2
184.76
13.46
198.22
+25%
Q3
186.22
14.16
200.37
+14%
Q4
188.59
14.64
203.23
+12%
Q1 2022
203.41
15.27
218.68
+16%
Q2
205.61
15.39
221.00
+11%
Q3
212.57
15.47
228.03
+14%
Q4
213.23
16.08
229.30
+13%
Q1 2023
234.95
17.28
252.23
+15%
Q2
245.34
17.31
262.66
+19%
Q3
251.64
16.93
268.57
+18%
Q4
258.30
17.28
275.58
+20%
Q1 2024
275.73
17.70
293.43
+16%
Q2
289.80
17.61
307.40
+17%
Q3
311.77
17.46
329.23
+23%
Q4
333.50
18.22
351.72
+28%
Q1 2025
364.50
18.84
383.34
+31%
Q2
402.14
19.10
421.25
+37%
Q3
427.68
19.23
446.91
+36%
Q4
446.65
21.93
468.57
+33%
Q1 2026
466.66
22.53
489.19
+28%
Medium-sized enterprises topped the total amount of credit facilities with approximately SAR 230.4 billion, or 47% of the total. Small enterprises followed with about SAR 169.7 billion, and micro enterprises with SAR 89.1 billion, the data showed.
Credit Facilities to MSMEs (SAR bln)
Enterprise
Value
% to Total
Medium
230.36
47%
Small
169.74
35%
Micro
89.09
18%
Total
489.19
100%
Medium-sized enterprises accounted for SAR 220.7 billion, or 47% of total facilities provided by the banking sector by the end of Q1 2026. Meanwhile, the share of small-sized enterprises reached SAR 160.4 billion and micro enterprises receive SAR 85.5 billion in financing.
Credit Facilities by Banks (SAR bln)
Period
Micro
Small
Medium
Total
Q1 2021
8.34
39.67
127.45
175.46
Q2
8.47
44.18
132.11
184.76
Q3
11.14
45.08
129.99
186.22
Q4
9.37
50.59
128.64
188.59
Q1 2022
13.83
54.04
135.54
203.41
Q2
14.94
55.78
134.88
205.61
Q3
14.37
61.55
136.64
212.57
Q4
15.18
65.08
132.97
213.23
Q1 2023
19.62
70.25
145.09
234.95
Q2
20.21
75.70
149.43
245.34
Q3
21.35
77.87
152.42
251.64
Q4
22.32
84.09
151.89
258.30
Q1 2024
26.80
95.19
153.74
275.73
Q2
31.13
98.26
160.41
289.80
Q3
33.50
104.15
174.12
311.77
Q4
39.60
113.98
179.93
333.50
Q1 2025
50.76
131.15
182.59
364.50
Q2
57.40
145.78
198.96
402.14
Q3
62.99
152.87
211.81
427.68
Q4
80.07
154.42
212.16
446.65
Q1 2026
85.55
160.37
220.75
466.66
Medium enterprises received SAR 9.6 billion of the total facilities offered by financing institutions in Q1 2026, while small and micro enterprises received around SAR 9.4 billion and SAR 3.5 billion in the same period, respectively.
Credit Facilities by Financing Institutions (SAR bln)
Period
Micro
Small
Medium
Total
Q1 2021
2.79
5.63
4.55
12.97
Q2
2.70
6.10
4.66
13.46
Q3
2.77
6.61
4.78
14.16
Q4
2.94
6.77
4.93
14.64
Q1 2022
3.15
7.22
4.90
15.27
Q2
3.17
7.26
4.97
15.39
Q3
3.42
7.17
4.87
15.47
Q4
3.20
7.54
5.34
16.08
Q1 2023
2.92
8.30
6.06
17.28
Q2
2.95
8.18
6.19
17.31
Q3
2.68
8.04
6.21
16.93
Q4
2.58
8.19
6.52
17.28
Q1 2024
2.59
8.26
6.85
17.70
Q2
2.57
8.14
6.90
17.61
Q3
2.64
7.88
6.93
17.46
Q4
2.59
8.27
7.36
18.22
Q1 2025
2.75
8.46
7.62
18.84
Q2
2.71
8.53
7.87
19.10
Q3
2.65
8.72
7.86
19.23
Q4
3.22
9.35
9.36
21.93
Q1 2026
3.54
9.38
9.61
22.53
The Kingdom of Saudi Arabia’s flag
Credit facilities extended to micro, small, and medium enterprises (MSMEs) grew 28% year-on-year (YoY) to SAR 489.2 billion in Q1 2026, data from the Saudi Central Bank (SAMA) showed.
The financing offered by the banking sector reached SAR 466.7 billion, representing 95% of the total facilities. Meanwhile, the financing institutions offered SAR 22.5 billion.
In Saudi Arabia, medium-sized enterprises are classified as those with annual revenues between SAR 40 million and SAR 200 million or employing 50 to 249 on rolls. Small enterprises are those generating annual revenues between SAR 3 million and SAR 40 million and employing between 6 and 49 people. Micro enterprises generate annual revenues of less than SAR 3 million and have less than five employees.
Credit Facilities by Sector (SAR bln)*
Period
Banking sector
Financing Institutions
Total
YoY Change
Q1 2021
175.46
12.97
188.43
+40%
Q2
184.76
13.46
198.22
+25%
Q3
186.22
14.16
200.37
+14%
Q4
188.59
14.64
203.23
+12%
Q1 2022
203.41
15.27
218.68
+16%
Q2
205.61
15.39
221.00
+11%
Q3
212.57
15.47
228.03
+14%
Q4
213.23
16.08
229.30
+13%
Q1 2023
234.95
17.28
252.23
+15%
Q2
245.34
17.31
262.66
+19%
Q3
251.64
16.93
268.57
+18%
Q4
258.30
17.28
275.58
+20%
Q1 2024
275.73
17.70
293.43
+16%
Q2
289.80
17.61
307.40
+17%
Q3
311.77
17.46
329.23
+23%
Q4
333.50
18.22
351.72
+28%
Q1 2025
364.50
18.84
383.34
+31%
Q2
402.14
19.10
421.25
+37%
Q3
427.68
19.23
446.91
+36%
Q4
446.65
21.93
468.57
+33%
Q1 2026
466.66
22.53
489.19
+28%
Medium-sized enterprises topped the total amount of credit facilities with approximately SAR 230.4 billion, or 47% of the total. Small enterprises followed with about SAR 169.7 billion, and micro enterprises with SAR 89.1 billion, the data showed.
Credit Facilities to MSMEs (SAR bln)
Enterprise
Value
% to Total
Medium
230.36
47%
Small
169.74
35%
Micro
89.09
18%
Total
489.19
100%
Medium-sized enterprises accounted for SAR 220.7 billion, or 47% of total facilities provided by the banking sector by the end of Q1 2026. Meanwhile, the share of small-sized enterprises reached SAR 160.4 billion and micro enterprises receive SAR 85.5 billion in financing.
Credit Facilities by Banks (SAR bln)
Period
Micro
Small
Medium
Total
Q1 2021
8.34
39.67
127.45
175.46
Q2
8.47
44.18
132.11
184.76
Q3
11.14
45.08
129.99
186.22
Q4
9.37
50.59
128.64
188.59
Q1 2022
13.83
54.04
135.54
203.41
Q2
14.94
55.78
134.88
205.61
Q3
14.37
61.55
136.64
212.57
Q4
15.18
65.08
132.97
213.23
Q1 2023
19.62
70.25
145.09
234.95
Q2
20.21
75.70
149.43
245.34
Q3
21.35
77.87
152.42
251.64
Q4
22.32
84.09
151.89
258.30
Q1 2024
26.80
95.19
153.74
275.73
Q2
31.13
98.26
160.41
289.80
Q3
33.50
104.15
174.12
311.77
Q4
39.60
113.98
179.93
333.50
Q1 2025
50.76
131.15
182.59
364.50
Q2
57.40
145.78
198.96
402.14
Q3
62.99
152.87
211.81
427.68
Q4
80.07
154.42
212.16
446.65
Q1 2026
85.55
160.37
220.75
466.66
Medium enterprises received SAR 9.6 billion of the total facilities offered by financing institutions in Q1 2026, while small and micro enterprises received around SAR 9.4 billion and SAR 3.5 billion in the same period, respectively.
Credit Facilities by Financing Institutions (SAR bln)
Period
Micro
Small
Medium
Total
Q1 2021
2.79
5.63
4.55
12.97
Q2
2.70
6.10
4.66
13.46
Q3
2.77
6.61
4.78
14.16
Q4
2.94
6.77
4.93
14.64
Q1 2022
3.15
7.22
4.90
15.27
Q2
3.17
7.26
4.97
15.39
Q3
3.42
7.17
4.87
15.47
Q4
3.20
7.54
5.34
16.08
Q1 2023
2.92
8.30
6.06
17.28
Q2
2.95
8.18
6.19
17.31
Q3
2.68
8.04
6.21
16.93
Q4
2.58
8.19
6.52
17.28
Q1 2024
2.59
8.26
6.85
17.70
Q2
2.57
8.14
6.90
17.61
Q3
2.64
7.88
6.93
17.46
Q4
2.59
8.27
7.36
18.22
Q1 2025
2.75
8.46
7.62
18.84
Q2
2.71
8.53
7.87
19.10
Q3
2.65
8.72
7.86
19.23
Q4
3.22
9.35
9.36
21.93
Q1 2026
3.54
9.38
9.61
22.53