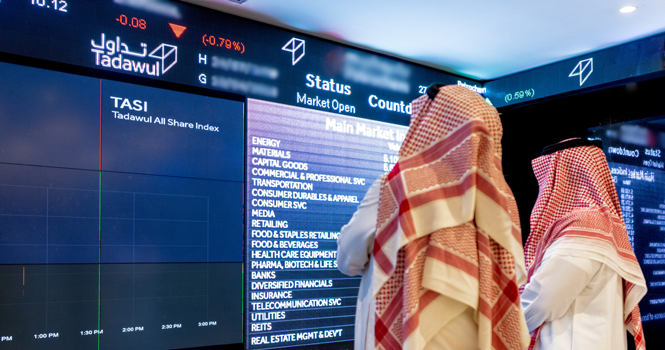
Traders at a GCC stock exchange
GCC equity markets posted mixed results in the first half of 2026, with only two of the seven tracked indices ending the six-month period in positive territory, while the remaining five declined. 
The Muscat Stock Exchange (MSX) led the region, surging 28%, or 1,641 points, to close at 7,508.
The Saudi Exchange (Tadawul) followed with a 3% gain, adding 309 points to end at 10,800. On the downside, five markets recorded losses.
Most GCC markets started 2026 in positive territory before diverging and ending the first quarter with broad-based losses, pressured by geopolitical tensions in the region and the resulting disruptions to shipping routes and supply chains. The MSX was the only exception, surging 39%, while Tadawul advanced 7% by the end of Q1 2026.
Market performance remained volatile at the start of the second quarter amid ongoing geopolitical tensions and sharp swings in oil prices, which climbed above $120 a barrel at the peak of the crisis before retreating sharply following a temporary agreement reached in June 2026. By the end of Q2 2026, five GCC markets posted gains, while the MSX and Tadawul declined 8% and 4%, respectively.
GCCEquityMarkets Performance in H1 2026
Market
December
2025
June
2026
Change
(Points)
Change %
Muscat
5,867
7508
1641
+28%
Saudi Arabia
10491
10800
309
+3%
Bahrain
2067
2043
(24)
(1%)
Dubai
6047
5956
(92)
(2%)
Abu Dhabi
9993
9804
(189)
(2%)
Kuwait*
9498
9083
(416)
(4%)
Qatar
10763
10242
(521)
(5%)
GCC Markets Traded Values in H1 2026
GCC traded values declined 2% to $307.5 billion in H1 2026, compared to $314.6 billion in H1 2025.
The decline was mainly driven by a 10% drop in Tadawul turnover to $164.4 billion in the first half of 2026, from $183.5 billion a year earlier.
GCC Markets Traded Values ($ bln)
Market
H1 2022
H1 2023
H1 2024
H1 2025
H1 2026
Saudi Arabia
276.7
158.6
272.9
183.5
164.4
Abu Dhabi
57.6
46.8
36.6
48.9
46.6
Kuwait
27.4
16.4
21.6
41.1
32.0
Qatar
13.5
12.7
12.5
22.8
31.0
Dubai
1.5
1.1
1.5
2.4
18.0
Muscat
26.5
17.0
16.5
14.6
15.2
Bahrain
0.27
0.32
0.42
1.24
0.27
Total
403.5
252.9
362.0
314.5
307.5
Key GCC Market Metrics in H1 2026
The combined market capitalization of GCC equity markets fell by $40.2 billion to $2.34 trillion by the end of H1 2026, compared to $2.38 trillion in the corresponding period of 2025.
Meanwhile, Tadawul ranked third among GCC markets in terms of the highest price-to-earnings (P/E) ratio at the end of H1 2026, at 22.56x, while its price-to-book (P/B) ratio stood at 2.98x.
Key Metrics in H1 2026
Market
Market Value
($ bln)
P/E Ratio
(×)
Book Value
(×)
June
2025
June
2026
June
2026
June
2026
Dubai
271.02
267.30
9.45
1.66
Bahrain
20.04
21.04
10.90
1.10
Qatar
174.55
169.29
11.24
1.26
Muscat
73.50
95.50
13.56
1.66
Kuwait
164.72
170.04
16.09
1.84
Saudi Arabia*
864.16
830.66
18.98
1.95
Abu Dhabi
810.27
784.24
22.56
2.44
Total
2378.27
2338.06
—
—
*Excluding Saudi Aramco
GCC Heavyweights
Among the 30 largest Gulf-listed companies, market capitalizations showed mixed performance in H1 2026, with 13 companies posting gains and 17 declining.
Saudi Energy Co. recorded the biggest increase, with its market capitalization rising 27%, followed by Alinma Bank at 20%, Saudi Aramco at 10%, and ADNOC Drilling at 7%.
Saudi Aramco remained the region’s most valuable listed company, with a market capitalization of $1.69 trillion, far ahead of second-ranked International Holding Co. (IHC) at $228.8 billion.
Top 30 GCC Heavyweights by Market Cap ($ mln)
Company
Market
December
2025
June
2026
Change%
Saudi Aramco
Saudi Arabia
1537829.0
1685610.7
+10%
IHC
Abu Dhabi
238616.5
228821.0
(4%)
Al Rajhi Bank
Saudi Arabia
104000.0
105440.0
+1%
TAQA
Abu Dhabi
103173.1
80517.9
(22%)
ADNOC Gas
Abu Dhabi
74191.3
71892.4
(3%)
Maaden
Saudi Arabia
60608.0
61856.0
+2%
SNB
Abu Dhabi
63205.3
61598.0
(3%)
stc
Saudi Arabia
57306.7
57653.3
+1%
Emirates NBD
Abu Dhabi
47901.2
51152.0
+7%
FAB
Saudi Arabia
52463.0
51139.4
(3%)
KFH
Kuwait
48854.5
49434.6
+1%
e
Abu Dhabi
43430.5
45467.0
+5%
QNB
Qatar
47349.4
43771.5
(8%)
SABIC
Saudi Arabia
41040.0
41240.0
+1%
Acwa
Saudi Arabia
37159.4
39653.1
+7%
DEWA
Dubai
37712.7
37576.6
(0.4%)
ADCB
Abu Dhabi
30808.5
31153.2
+1%
Emaar Properties
Dubai
33814.8
29169.8
(14%)
ADNOC Drilling
Abu Dhabi
23264.8
24963.9
+7%
NBK
Kuwait
28938.6
24120.5
(17%)
Alpha Dhabi Holding
Abu Dhabi
25867.9
21538.5
(17%)
Riyad Bank
Saudi Arabia
21717.3
21237.3
(2%)
Buruj
Abu Dhabi
21525.3
20870.6
(3%)
ADIB
Abu Dhabi
20531.1
20451.9
(0.4%)
2PointZero
Abu Dhabi
24563.9
20140.5
(18%)
Sulaiman Al Habib
Saudi Arabia
23986.7
19786.7
(18%)
Saudi Energy
Saudi Arabia
15610.8
19777.4
+27%
Alinma Bank
Saudi Arabia
16256.0
19552.0
+20%
IQCD
Qatar
19828.7
18283.0
(8%)
Aldar Properties
Abu Dhabi
18626.2
17727.0
(5%)
Top Gainers
The list of the 30 best-performing stocks across GCC markets in H1 2026 included nine companies from Tadawul, eight each from Boursa Kuwait and MSX, three from the Abu Dhabi Securities Exchange (ADX), and two from the Qatar Stock Exchange (QSE).
Traders at a GCC stock exchange
GCC equity markets posted mixed results in the first half of 2026, with only two of the seven tracked indices ending the six-month period in positive territory, while the remaining five declined.
The Muscat Stock Exchange (MSX) led the region, surging 28%, or 1,641 points, to close at 7,508.
The Saudi Exchange (Tadawul) followed with a 3% gain, adding 309 points to end at 10,800. On the downside, five markets recorded losses.
Most GCC markets started 2026 in positive territory before diverging and ending the first quarter with broad-based losses, pressured by geopolitical tensions in the region and the resulting disruptions to shipping routes and supply chains. The MSX was the only exception, surging 39%, while Tadawul advanced 7% by the end of Q1 2026.
Market performance remained volatile at the start of the second quarter amid ongoing geopolitical tensions and sharp swings in oil prices, which climbed above $120 a barrel at the peak of the crisis before retreating sharply following a temporary agreement reached in June 2026. By the end of Q2 2026, five GCC markets posted gains, while the MSX and Tadawul declined 8% and 4%, respectively.
GCCEquityMarkets Performance in H1 2026
Market
December
2025
June
2026
Change
(Points)
Change %
Muscat
5,867
7508
1641
+28%
Saudi Arabia
10491
10800
309
+3%
Bahrain
2067
2043
(24)
(1%)
Dubai
6047
5956
(92)
(2%)
Abu Dhabi
9993
9804
(189)
(2%)
Kuwait*
9498
9083
(416)
(4%)
Qatar
10763
10242
(521)
(5%)
GCC Markets Traded Values in H1 2026
GCC traded values declined 2% to $307.5 billion in H1 2026, compared to $314.6 billion in H1 2025.
The decline was mainly driven by a 10% drop in Tadawul turnover to $164.4 billion in the first half of 2026, from $183.5 billion a year earlier.
GCC Markets Traded Values ($ bln)
Market
H1 2022
H1 2023
H1 2024
H1 2025
H1 2026
Saudi Arabia
276.7
158.6
272.9
183.5
164.4
Abu Dhabi
57.6
46.8
36.6
48.9
46.6
Kuwait
27.4
16.4
21.6
41.1
32.0
Qatar
13.5
12.7
12.5
22.8
31.0
Dubai
1.5
1.1
1.5
2.4
18.0
Muscat
26.5
17.0
16.5
14.6
15.2
Bahrain
0.27
0.32
0.42
1.24
0.27
Total
403.5
252.9
362.0
314.5
307.5
Key GCC Market Metrics in H1 2026
The combined market capitalization of GCC equity markets fell by $40.2 billion to $2.34 trillion by the end of H1 2026, compared to $2.38 trillion in the corresponding period of 2025.
Meanwhile, Tadawul ranked third among GCC markets in terms of the highest price-to-earnings (P/E) ratio at the end of H1 2026, at 22.56x, while its price-to-book (P/B) ratio stood at 2.98x.
Key Metrics in H1 2026
Market
Market Value
($ bln)
P/E Ratio
(×)
Book Value
(×)
June
2025
June
2026
June
2026
June
2026
Dubai
271.02
267.30
9.45
1.66
Bahrain
20.04
21.04
10.90
1.10
Qatar
174.55
169.29
11.24
1.26
Muscat
73.50
95.50
13.56
1.66
Kuwait
164.72
170.04
16.09
1.84
Saudi Arabia*
864.16
830.66
18.98
1.95
Abu Dhabi
810.27
784.24
22.56
2.44
Total
2378.27
2338.06
—
—
*Excluding Saudi Aramco
GCC Heavyweights
Among the 30 largest Gulf-listed companies, market capitalizations showed mixed performance in H1 2026, with 13 companies posting gains and 17 declining.
Saudi Energy Co. recorded the biggest increase, with its market capitalization rising 27%, followed by Alinma Bank at 20%, Saudi Aramco at 10%, and ADNOC Drilling at 7%.
Saudi Aramco remained the region’s most valuable listed company, with a market capitalization of $1.69 trillion, far ahead of second-ranked International Holding Co. (IHC) at $228.8 billion.
Top 30 GCC Heavyweights by Market Cap ($ mln)
Company
Market
December
2025
June
2026
Change%
Saudi Aramco
Saudi Arabia
1537829.0
1685610.7
+10%
IHC
Abu Dhabi
238616.5
228821.0
(4%)
Al Rajhi Bank
Saudi Arabia
104000.0
105440.0
+1%
TAQA
Abu Dhabi
103173.1
80517.9
(22%)
ADNOC Gas
Abu Dhabi
74191.3
71892.4
(3%)
Maaden
Saudi Arabia
60608.0
61856.0
+2%
SNB
Abu Dhabi
63205.3
61598.0
(3%)
stc
Saudi Arabia
57306.7
57653.3
+1%
Emirates NBD
Abu Dhabi
47901.2
51152.0
+7%
FAB
Saudi Arabia
52463.0
51139.4
(3%)
KFH
Kuwait
48854.5
49434.6
+1%
e
Abu Dhabi
43430.5
45467.0
+5%
QNB
Qatar
47349.4
43771.5
(8%)
SABIC
Saudi Arabia
41040.0
41240.0
+1%
Acwa
Saudi Arabia
37159.4
39653.1
+7%
DEWA
Dubai
37712.7
37576.6
(0.4%)
ADCB
Abu Dhabi
30808.5
31153.2
+1%
Emaar Properties
Dubai
33814.8
29169.8
(14%)
ADNOC Drilling
Abu Dhabi
23264.8
24963.9
+7%
NBK
Kuwait
28938.6
24120.5
(17%)
Alpha Dhabi Holding
Abu Dhabi
25867.9
21538.5
(17%)
Riyad Bank
Saudi Arabia
21717.3
21237.3
(2%)
Buruj
Abu Dhabi
21525.3
20870.6
(3%)
ADIB
Abu Dhabi
20531.1
20451.9
(0.4%)
2PointZero
Abu Dhabi
24563.9
20140.5
(18%)
Sulaiman Al Habib
Saudi Arabia
23986.7
19786.7
(18%)
Saudi Energy
Saudi Arabia
15610.8
19777.4
+27%
Alinma Bank
Saudi Arabia
16256.0
19552.0
+20%
IQCD
Qatar
19828.7
18283.0
(8%)
Aldar Properties
Abu Dhabi
18626.2
17727.0
(5%)
Top Gainers
The list of the 30 best-performing stocks across GCC markets in H1 2026 included nine companies from Tadawul, eight each from Boursa Kuwait and MSX, three from the Abu Dhabi Securities Exchange (ADX), and two from the Qatar Stock Exchange (QSE).