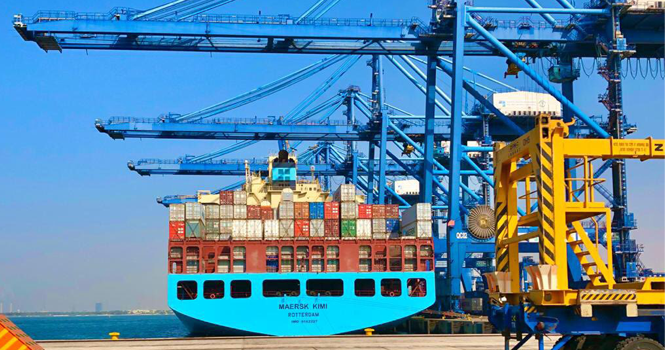
Jeddah Islamic Port
Saudi Arabia’s merchandise imports increased 7% year-on-year (YoY) to SAR 76.1 billion in February 2026, according to data issued by the General Authority for Statistics (GASTAT). 
Compared to January 2026, merchandise imports were down 10%, or nearly SAR 8.3 billion.
Machinery and mechanical appliances, electrical equipment and their parts topped imports in February, totaling SAR 23.2 billion, or about 30% of the Kingdom’s total imports. Vehicles, aircraft, vessels, and associated transport equipment followed at around 12%.
Saudi Imports in February by Segment (SAR bln)
Segment
Feb. 2025
Feb. 2026
Change (Value)
Change (%)
Machinery and Mechanical Appliances; Electrical Equipment; Parts Thereof
18.15
23.18
+5.04
+28%
Vehicles, Aircraft, Vessels, and Associated Transport Equipment
9.86
8.82
(1.04)
(11%)
Base Metals and Articles of Base Metal
7.26
7.01
(0.25)
(3%)
Precious Stones or Metals and Their Articles, Jewelry
2.27
6.99
+4.71
+207%
Products of the Chemical or Allied Industries
6.40
5.99
(0.42)
(6%)
Mineral products
5.13
3.25
(1.88)
(37%)
Vegetable Products
3.74
2.92
(0.83)
(22%)
Food Products, Beverages, and Tobacco
3.01
2.68
(0.33)
(11%)
Textile Materials and Products
2.41
2.61
+0.20
+8%
Plastics and Articles Thereof; Rubber and Articles Thereof
2.25
2.08
(0.17)
(7%)
Others
10.94
10.60
(0.34)
(3%)
Total
71.42
76.13
+4.70
+7%
Saudi Arabia’s imports came mainly from China, with SAR 22.7 billion, representing 30% of the total in February 2026. The UAE came in second with SAR 6.1 billion, followed by the US at SAR 5.6 billion.
The Kingdom’s top 10 exporters accounted for about 71% of total imports, equivalent to SAR 54.2 billion.
Top 10 Exporters to Saudi Arabia in February (SAR bln)
Country
Value
% of Total
China
22.7
29.8%
UAE
6.1
8.0%
US
5.6
7.4%
India
4.3
5.7%
Switzerland
3.5
4.6%
Japan
3.4
4.4%
Germany
2.6
3.4%
Italy
2.1
2.8%
Egypt
2.0
2.6%
South Korea
1.9
2.5%
Other Countries
21.9
28.8%
Total
76.1
100%
Jeddah Islamic Port
Saudi Arabia’s merchandise imports increased 7% year-on-year (YoY) to SAR 76.1 billion in February 2026, according to data issued by the General Authority for Statistics (GASTAT).
Compared to January 2026, merchandise imports were down 10%, or nearly SAR 8.3 billion.
Machinery and mechanical appliances, electrical equipment and their parts topped imports in February, totaling SAR 23.2 billion, or about 30% of the Kingdom’s total imports. Vehicles, aircraft, vessels, and associated transport equipment followed at around 12%.
Saudi Imports in February by Segment (SAR bln)
Segment
Feb. 2025
Feb. 2026
Change (Value)
Change (%)
Machinery and Mechanical Appliances; Electrical Equipment; Parts Thereof
18.15
23.18
+5.04
+28%
Vehicles, Aircraft, Vessels, and Associated Transport Equipment
9.86
8.82
(1.04)
(11%)
Base Metals and Articles of Base Metal
7.26
7.01
(0.25)
(3%)
Precious Stones or Metals and Their Articles, Jewelry
2.27
6.99
+4.71
+207%
Products of the Chemical or Allied Industries
6.40
5.99
(0.42)
(6%)
Mineral products
5.13
3.25
(1.88)
(37%)
Vegetable Products
3.74
2.92
(0.83)
(22%)
Food Products, Beverages, and Tobacco
3.01
2.68
(0.33)
(11%)
Textile Materials and Products
2.41
2.61
+0.20
+8%
Plastics and Articles Thereof; Rubber and Articles Thereof
2.25
2.08
(0.17)
(7%)
Others
10.94
10.60
(0.34)
(3%)
Total
71.42
76.13
+4.70
+7%
Saudi Arabia’s imports came mainly from China, with SAR 22.7 billion, representing 30% of the total in February 2026. The UAE came in second with SAR 6.1 billion, followed by the US at SAR 5.6 billion.
The Kingdom’s top 10 exporters accounted for about 71% of total imports, equivalent to SAR 54.2 billion.
Top 10 Exporters to Saudi Arabia in February (SAR bln)
Country
Value
% of Total
China
22.7
29.8%
UAE
6.1
8.0%
US
5.6
7.4%
India
4.3
5.7%
Switzerland
3.5
4.6%
Japan
3.4
4.4%
Germany
2.6
3.4%
Italy
2.1
2.8%
Egypt
2.0
2.6%
South Korea
1.9
2.5%
Other Countries
21.9
28.8%
Total
76.1
100%