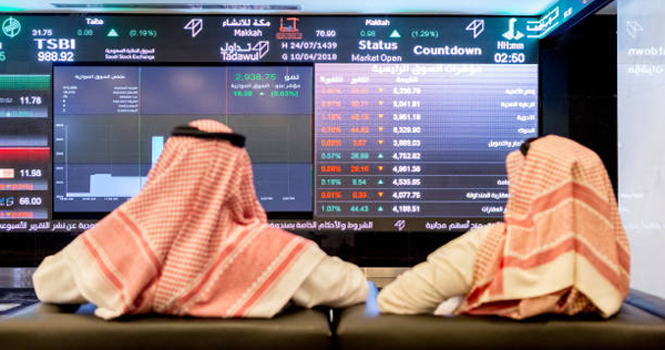
Tadawul data shows foreign investors’ ownership accounts for 4.75% of total market cap
The market capitalization of the Main Market (TASI) rose 2.5% (or nearly SAR 227.7 billion) week-on-week to about SAR 9.36 trillion in the week ended March 5, according to data issued by Tadawul. 
Foreign investors’ ownership accounted for 4.75% of the total market capitalization.
Ownership Value by Nationality Investor Type (SAR bln)
InvestorType
Feb. 26, 2026
March 5, 2026
Change
Saudi Investors
Retail
144.36
144.71
0.35
High-Net-Worth Investors
245.48
246.90
1.42
Individual Professional Investors
436.25
437.34
1.09
Individual DPMs
15.56
15.71
0.15
Total (Retail)
841.66
844.67
3.01
Corporates
1525.48
1559.70
34.22
Mutual Funds
271.99
274.24
2.26
Government Entities
5912.56
6100.84
188.28
Institutional DPMs
68.06
67.59
(0.47)
Total (Corporate Investors)
7778.08
8002.37
224.28
Total (Saudi Investors)
8619.74
8847.03
227.29
GCC Investors
Individuals
4.74
4.68
(0.06)
Institutions
65.94
65.60
(0.33)
DPMs
3.57
3.52
(0.05)
Total (GCC Investors)
74.25
73.81
(0.44)
Foreign Investors
SWAP Holders
9.84
9.90
0.06
Foreign Residents
368.85
369.89
1.04
QFIs
2.05
2.07
0.02
DPMs
16.87
16.72
(0.15)
Strategic Investors
46.17
46.08
(0.08)
Total (Foreign Investors)
443.78
444.66
0.88
Total
9137.78
9365.50
227.73
*Excluding corporate procedures
Ownership Ratio by Nationality Investor Type*
InvestorType
Feb. 26, 2026
March 5, 2026
Change
Issued Shares
Free Float
Issued Shares
Free Float
Issued Shares
Free Float
Saudi Investors
Retail
1.58%
4.46%
1.55%
4.45%
(0.03%)
—
High-Net-Worth Investors
2.69%
7.63%
2.64%
7.55%
(0.05%)
(0.08%)
Individual Professional Investors
4.77%
10.79%
4.67%
10.64%
(0.10%)
(0.15%)
Individual DPMs
0.17%
0.49%
0.17%
0.48%
—
(0.01%)
Total (Retail)
9.21%
23.37%
9.02%
23.13%
(0.19%)
(0.23%)
Corporates
16.69%
40.17%
16.65%
40.57%
(0.04%)
0.40%
Mutual Funds
2.98%
7.15%
2.93%
7.06%
(0.05%)
(0.09%)
Government Entities
64.70%
12.92%
65.14%
13.04%
0.44%
0.12%
Institutional DPMs
0.74%
2.04%
0.72%
2.01%
(0.02%)
(0.04%)
Total (Corporate Investors)
85.12%
62.28%
85.45%
62.68%
0.33%
0.39%
Total (Saudi Investors)
94.33%
85.65%
94.46%
85.81%
0.13%
0.16%
GCC Investors
Individuals
0.05%
0.15%
0.05%
0.15%
—
—
Institutions
0.72%
1.28%
0.70%
1.26%
(0.02%)
(0.02%)
DPMs
0.04%
0.12%
0.04%
0.11%
—
—
Total (GCC Investors)
0.81%
1.55%
0.79%
1.52%
(0.02%)
(0.02%)
Foreign Investors
SWAP Holders
0.11%
0.24%
0.11%
0.24%
—
0.01%
Foreign Residents
4.04%
11.96%
3.95%
11.83%
(0.09%)
(0.13%)
QFIs
0.02%
0.07%
0.02%
0.07%
—
—
DPMs
0.18%
0.55%
0.18%
0.53%
(0.01%)
(0.01%)
Strategic Investors
0.51%
—
0.49%
—
(0.01%)
—
Total (Foreign Investors)
4.86%
12.81%
4.75%
12.67%
(0.11%)
(0.14%)
*Excluding corporate actions.
The data shows that institutions control 95.7% of issued shares on Tadawul and 87.6% of free float shares.
Ownership Value Ratio by Investor Classification (SAR bln)
Investor Classification
Feb. 26, 2026
March 5, 2026
Change in Ownership
Equity
Issued Shares
Free Float
Equity
Issued Shares
Free Float
Institutional
8733.35
95.57%
87.52%
8959.31
95.66%
87.60%
225.96
Non-Institutional
404.43
4.43%
12.48%
406.20
4.34%
12.40%
1.77
Total
9137.78
100%
100%
9365.50
100%
100%
227.73
Tadawul data shows foreign investors’ ownership accounts for 4.75% of total market cap
The market capitalization of the Main Market (TASI) rose 2.5% (or nearly SAR 227.7 billion) week-on-week to about SAR 9.36 trillion in the week ended March 5, according to data issued by Tadawul.
Foreign investors’ ownership accounted for 4.75% of the total market capitalization.
Ownership Value by Nationality Investor Type (SAR bln)
InvestorType
Feb. 26, 2026
March 5, 2026
Change
Saudi Investors
Retail
144.36
144.71
0.35
High-Net-Worth Investors
245.48
246.90
1.42
Individual Professional Investors
436.25
437.34
1.09
Individual DPMs
15.56
15.71
0.15
Total (Retail)
841.66
844.67
3.01
Corporates
1525.48
1559.70
34.22
Mutual Funds
271.99
274.24
2.26
Government Entities
5912.56
6100.84
188.28
Institutional DPMs
68.06
67.59
(0.47)
Total (Corporate Investors)
7778.08
8002.37
224.28
Total (Saudi Investors)
8619.74
8847.03
227.29
GCC Investors
Individuals
4.74
4.68
(0.06)
Institutions
65.94
65.60
(0.33)
DPMs
3.57
3.52
(0.05)
Total (GCC Investors)
74.25
73.81
(0.44)
Foreign Investors
SWAP Holders
9.84
9.90
0.06
Foreign Residents
368.85
369.89
1.04
QFIs
2.05
2.07
0.02
DPMs
16.87
16.72
(0.15)
Strategic Investors
46.17
46.08
(0.08)
Total (Foreign Investors)
443.78
444.66
0.88
Total
9137.78
9365.50
227.73
*Excluding corporate procedures
Ownership Ratio by Nationality Investor Type*
InvestorType
Feb. 26, 2026
March 5, 2026
Change
Issued Shares
Free Float
Issued Shares
Free Float
Issued Shares
Free Float
Saudi Investors
Retail
1.58%
4.46%
1.55%
4.45%
(0.03%)
—
High-Net-Worth Investors
2.69%
7.63%
2.64%
7.55%
(0.05%)
(0.08%)
Individual Professional Investors
4.77%
10.79%
4.67%
10.64%
(0.10%)
(0.15%)
Individual DPMs
0.17%
0.49%
0.17%
0.48%
—
(0.01%)
Total (Retail)
9.21%
23.37%
9.02%
23.13%
(0.19%)
(0.23%)
Corporates
16.69%
40.17%
16.65%
40.57%
(0.04%)
0.40%
Mutual Funds
2.98%
7.15%
2.93%
7.06%
(0.05%)
(0.09%)
Government Entities
64.70%
12.92%
65.14%
13.04%
0.44%
0.12%
Institutional DPMs
0.74%
2.04%
0.72%
2.01%
(0.02%)
(0.04%)
Total (Corporate Investors)
85.12%
62.28%
85.45%
62.68%
0.33%
0.39%
Total (Saudi Investors)
94.33%
85.65%
94.46%
85.81%
0.13%
0.16%
GCC Investors
Individuals
0.05%
0.15%
0.05%
0.15%
—
—
Institutions
0.72%
1.28%
0.70%
1.26%
(0.02%)
(0.02%)
DPMs
0.04%
0.12%
0.04%
0.11%
—
—
Total (GCC Investors)
0.81%
1.55%
0.79%
1.52%
(0.02%)
(0.02%)
Foreign Investors
SWAP Holders
0.11%
0.24%
0.11%
0.24%
—
0.01%
Foreign Residents
4.04%
11.96%
3.95%
11.83%
(0.09%)
(0.13%)
QFIs
0.02%
0.07%
0.02%
0.07%
—
—
DPMs
0.18%
0.55%
0.18%
0.53%
(0.01%)
(0.01%)
Strategic Investors
0.51%
—
0.49%
—
(0.01%)
—
Total (Foreign Investors)
4.86%
12.81%
4.75%
12.67%
(0.11%)
(0.14%)
*Excluding corporate actions.
The data shows that institutions control 95.7% of issued shares on Tadawul and 87.6% of free float shares.
Ownership Value Ratio by Investor Classification (SAR bln)
Investor Classification
Feb. 26, 2026
March 5, 2026
Change in Ownership
Equity
Issued Shares
Free Float
Equity
Issued Shares
Free Float
Institutional
8733.35
95.57%
87.52%
8959.31
95.66%
87.60%
225.96
Non-Institutional
404.43
4.43%
12.48%
406.20
4.34%
12.40%
1.77
Total
9137.78
100%
100%
9365.50
100%
100%
227.73