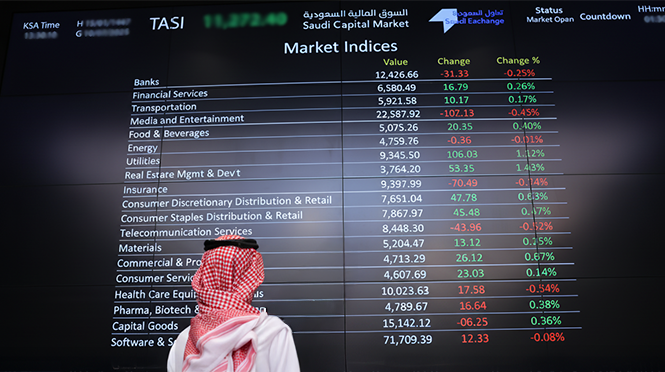
Tadawul trading screen
The market capitalization of the Main Market (TASI) reached approximately SAR 9.85 trillion at the end of March 2026, representing an increase of about 7.9%, or more than SAR 721 billion, compared to February 2026, according to data issued bythe Saudi Exchange (Tadawul). 
Foreign investors’ ownership accounted for 4.69% of the total market capital of listed shares as of March 31, 2026.
Ownership Value by NationalityInvestor Type (SAR bln)
Investor Type
Feb. 26, 2026
March 31, 2026
Change
Saudi Investors
Retail
142.87
150.21
7.34
High-Net-Worth Investors
246.06
259.30
13.24
Individual Professional Investors
437.17
458.18
21.01
Individual DPMs
15.74
16.25
0.51
Total (Retail)
841.84
883.94
42.10
Corporate
1,525.48
1,655.04
129.56
Mutual Funds
271.99
293.25
21.26
Government Entities
5,912.56
6,418.15
505.59
Institutional DPMs
67.88
69.55
1.67
Total (Corporate Investors)
7,777.90
8,436.00
658.10
Total (Saudi investors)
8,619.74
9,319.93
700.19
GCC Investors
Individuals
4.74
4.93
0.19
Institutions
65.94
68.25
2.31
DPMs
3.57
3.61
0.04
Total (GCC investors)
74.25
76.79
2.54
Foreign Investors
SWAP Holders
9.84
10.63
0.79
Foreign Residents
368.85
382.94
14.09
QFIs
2.05
2.16
0.11
DPMs
16.87
16.90
0.03
Strategic Partners
46.17
49.50
3.33
Total (Foreign investors)
443.78
462.13
18.35
Total
9,137.78
9,858.85
721.07
Ownership Ratio by Nationality Investor Type*
Investor Type
Feb. 26, 2026
March 31, 2026
Change
Issued Shares
Free Float
Issued Shares
Free Float
Issued Shares
Free Float
Saudi Investors
Retail
1.56%
4.46%
1.52%
4.40%
(0.04%)
(0.05%)
High-Net-Worth Investors
2.69%
7.63%
2.63%
7.56%
(0.06%)
(0.07%)
Individual Professional Investors
4.78%
10.79%
4.65%
10.46%
(0.14%)
(0.33%)
Individual DPMs
0.17%
0.49%
0.16%
0.48%
(0.01%)
(0.01%)
Total (Retail)
9.21%
23.37%
8.97%
22.90%
(0.25%)
(0.47%)
Corporates
16.69%
40.17%
16.79%
40.86%
0.09%
0.69%
Mutual Funds
2.98%
7.15%
2.97%
7.03%
(0.01%)
(0.12%)
Government Entities
64.70%
12.92%
65.10%
13.21%
0.40%
0.29%
Institutional DPMs
0.74%
2.04%
0.71%
1.97%
(0.04%)
(0.08%)
Total (Corporate Investors)
85.12%
62.28%
85.57%
63.07%
0.45%
0.79%
Total (Saudi Investors)
94.33%
85.65%
94.53%
85.97%
0.20%
0.32%
GCC Investors
Individuals
0.05%
0.15%
0.05%
0.15%
—
—
Institutions
0.72%
1.28%
0.69%
1.25%
(0.03%)
(0.03%)
DPMs
0.04%
0.12%
0.04%
0.11%
—
(0.01%)
Total (GCC Investors)
0.81%
1.55%
0.78%
1.51%
(0.03%)
(0.04%)
Foreign Investors
SWAP Holders
0.11%
0.24%
0.11%
0.25%
—
0.02%
Foreign Residents
4.04%
11.96%
3.88%
11.68%
(0.15%)
(0.27%)
QFIs
0.02%
0.07%
0.02%
0.07%
—
—
DPMs
0.18%
0.55%
0.17%
0.52%
(0.01%)
(0.03%)
Strategic Partners
0.51%
—
0.50%
—
(0.01%)
—
Total (Foreign Investors)
4.86%
12.81%
4.69%
12.52%
(0.17%)
(0.29%)
Ownership’s Value Ratio by Investor Classification (SAR bln)
Investor Type
Feb. 26, 2026
March 31, 2026
Change in Ownership
Equity
Issued Shares
Free Float
Equity
Issued Shares
Free Float
Institutional
8,734.26
95.58%
87.52%
9,433.78
95.69%
87.63%
699.52
Non-Institutional
403.52
4.42%
12.48%
425.07
4.31%
12.37%
21.55
Total
9,137.78
100%
100%
9,858.85
100%
100%
721.07
Tadawul trading screen
The market capitalization of the Main Market (TASI) reached approximately SAR 9.85 trillion at the end of March 2026, representing an increase of about 7.9%, or more than SAR 721 billion, compared to February 2026, according to data issued bythe Saudi Exchange (Tadawul).
Foreign investors’ ownership accounted for 4.69% of the total market capital of listed shares as of March 31, 2026.
Ownership Value by NationalityInvestor Type (SAR bln)
Investor Type
Feb. 26, 2026
March 31, 2026
Change
Saudi Investors
Retail
142.87
150.21
7.34
High-Net-Worth Investors
246.06
259.30
13.24
Individual Professional Investors
437.17
458.18
21.01
Individual DPMs
15.74
16.25
0.51
Total (Retail)
841.84
883.94
42.10
Corporate
1,525.48
1,655.04
129.56
Mutual Funds
271.99
293.25
21.26
Government Entities
5,912.56
6,418.15
505.59
Institutional DPMs
67.88
69.55
1.67
Total (Corporate Investors)
7,777.90
8,436.00
658.10
Total (Saudi investors)
8,619.74
9,319.93
700.19
GCC Investors
Individuals
4.74
4.93
0.19
Institutions
65.94
68.25
2.31
DPMs
3.57
3.61
0.04
Total (GCC investors)
74.25
76.79
2.54
Foreign Investors
SWAP Holders
9.84
10.63
0.79
Foreign Residents
368.85
382.94
14.09
QFIs
2.05
2.16
0.11
DPMs
16.87
16.90
0.03
Strategic Partners
46.17
49.50
3.33
Total (Foreign investors)
443.78
462.13
18.35
Total
9,137.78
9,858.85
721.07
Ownership Ratio by Nationality Investor Type*
Investor Type
Feb. 26, 2026
March 31, 2026
Change
Issued Shares
Free Float
Issued Shares
Free Float
Issued Shares
Free Float
Saudi Investors
Retail
1.56%
4.46%
1.52%
4.40%
(0.04%)
(0.05%)
High-Net-Worth Investors
2.69%
7.63%
2.63%
7.56%
(0.06%)
(0.07%)
Individual Professional Investors
4.78%
10.79%
4.65%
10.46%
(0.14%)
(0.33%)
Individual DPMs
0.17%
0.49%
0.16%
0.48%
(0.01%)
(0.01%)
Total (Retail)
9.21%
23.37%
8.97%
22.90%
(0.25%)
(0.47%)
Corporates
16.69%
40.17%
16.79%
40.86%
0.09%
0.69%
Mutual Funds
2.98%
7.15%
2.97%
7.03%
(0.01%)
(0.12%)
Government Entities
64.70%
12.92%
65.10%
13.21%
0.40%
0.29%
Institutional DPMs
0.74%
2.04%
0.71%
1.97%
(0.04%)
(0.08%)
Total (Corporate Investors)
85.12%
62.28%
85.57%
63.07%
0.45%
0.79%
Total (Saudi Investors)
94.33%
85.65%
94.53%
85.97%
0.20%
0.32%
GCC Investors
Individuals
0.05%
0.15%
0.05%
0.15%
—
—
Institutions
0.72%
1.28%
0.69%
1.25%
(0.03%)
(0.03%)
DPMs
0.04%
0.12%
0.04%
0.11%
—
(0.01%)
Total (GCC Investors)
0.81%
1.55%
0.78%
1.51%
(0.03%)
(0.04%)
Foreign Investors
SWAP Holders
0.11%
0.24%
0.11%
0.25%
—
0.02%
Foreign Residents
4.04%
11.96%
3.88%
11.68%
(0.15%)
(0.27%)
QFIs
0.02%
0.07%
0.02%
0.07%
—
—
DPMs
0.18%
0.55%
0.17%
0.52%
(0.01%)
(0.03%)
Strategic Partners
0.51%
—
0.50%
—
(0.01%)
—
Total (Foreign Investors)
4.86%
12.81%
4.69%
12.52%
(0.17%)
(0.29%)
Ownership’s Value Ratio by Investor Classification (SAR bln)
Investor Type
Feb. 26, 2026
March 31, 2026
Change in Ownership
Equity
Issued Shares
Free Float
Equity
Issued Shares
Free Float
Institutional
8,734.26
95.58%
87.52%
9,433.78
95.69%
87.63%
699.52
Non-Institutional
403.52
4.42%
12.48%
425.07
4.31%
12.37%
21.55
Total
9,137.78
100%
100%
9,858.85
100%
100%
721.07