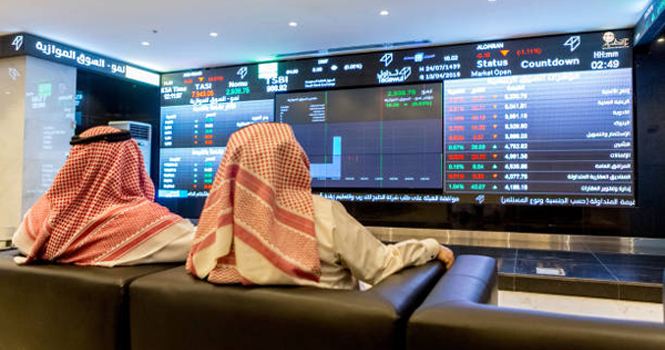
Tadawul trading screen
Meanwhile, foreign investors’ ownership accounted for 4.65% of the total market capital. 
Ownership Value by Nationality and Investor Type – (SAR bln)
Investor Type
Oct. 16, 2025
Oct. 23, 2025
Change
Saudi Investors
Retail
162.19
164.73
2.54
High-Net-Worth Investors
269.95
266.65
(3.30)
Individual Professional Investors
481.05
471.41
(9.64)
Individual DPMs
17.40
17.16
(0.23)
Total (Retail)
930.59
919.96
(10.63)
Corporates
1661.38
1666.28
4.90
Mutual Funds
304.87
303.07
(1.81)
Government Entities
6043.45
6150.50
107.05
Institutional DPMs
77.68
76.58
(1.10)
Total (Corporate Investors)
8087.38
8196.43
109.05
Total (Saudi Investors)
9017.98
9116.39
98.42
GCC Investors
Individuals
5.09
5.04
(0.05)
Institutions
66.39
66.15
(0.24)
DPMs
3.97
3.89
(0.07)
Total (GCC Investors)
75.44
75.08
(0.36)
Foreign Investors
SWAP Holders
2.33
2.29
(0.04)
Foreign Residents
19.90
19.46
(0.43)
QFIs
365.43
363.99
(1.44)
DPMs
15.74
15.18
(0.56)
Strategic Partners
48.51
47.06
(1.45)
Total (Foreign Investors)
451.91
447.98
(3.93)
Total
9545.33
9639.45
94.12
Ownership Ratio by Nationality Investor Type
Investor Type
Oct. 16, 2025
Oct. 23, 2025
Change
Issued Shares
Free Float
Issued Shares
Free Float
Issued Shares
Free Float
Saudi Investors
Retail
1.70%
4.70%
1.71%
4.78%
0.01%
0.08%
High-Net-Worth Investors
2.83%
7.78%
2.77%
7.69%
(0.06%)
(0.09%)
Individual Professional Investors
5.04%
10.95%
4.89%
10.72%
(0.15%)
(0.23%)
Individual DPMs
0.18%
0.50%
0.18%
0.50%
—
(0.01%)
Total (Retail)
9.75%
23.93%
9.54%
23.68%
(0.21%)
(0.25%)
Corporates
17.41%
40.23%
17.29%
40.53%
(0.12%)
0.30%
Mutual Funds
3.19%
7.39%
3.14%
7.32%
(0.05%)
(0.07%)
Government Entities
63.31%
12.60%
63.81%
12.73%
0.49%
0.13%
Institutional DPMs
0.81%
2.15%
0.79%
2.12%
(0.02%)
(0.03%)
Total (Corporate Investors)
84.73%
62.37%
85.03%
62.70%
0.30%
0.33%
Total (Saudi Investors)
94.48%
86.30%
94.57%
86.39%
0.10%
0.09%
GCC Investors
Individuals
0.05%
0.15%
0.05%
0.15%
—
—
Institutions
0.70%
1.16%
0.69%
1.15%
(0.01%)
(0.01%)
DPMs
0.04%
0.12%
0.04%
0.12%
—
—
Total (GCC Investors)
0.79%
1.44%
0.78%
1.42%
(0.01%)
(0.01%)
Foreign Investors
SWAP Holders
0.02%
0.07%
0.02%
0.07%
—
—
Foreign Residents
0.21%
0.60%
0.20%
0.59%
(0.01%)
(0.01%)
QFIs
3.83%
11.11%
3.78%
11.07%
(0.05%)
(0.04%)
DPMs
0.16%
0.48%
0.16%
0.46%
(0.01%)
(0.02%)
Strategic Partners
0.51%
—
0.49%
—
(0.02%)
—
Total (Foreign Investors)
4.73%
12.26%
4.65%
12.19%
(0.09%)
(0.07%)
Ownership’s Value Ratio by Investor Type (SAR bln)
Investor Type
Oct. 16, 2025
Oct. 23, 2025
Change in Ownership
Equity
Issued Shares
Free Float
Equity
Issued Shares
Free Float
Institutional
9088.20
95.21%
86.76%
9183.57
95.27%
86.79%
95.36
Non-Institutional
457.13
4.79%
13.24%
455.88
4.73%
13.21%
(1.24)
Total
9545.33
100%
100%
9639.45
100%
100%
94.12
Tadawul trading screen
Meanwhile, foreign investors’ ownership accounted for 4.65% of the total market capital.
Ownership Value by Nationality and Investor Type – (SAR bln)
Investor Type
Oct. 16, 2025
Oct. 23, 2025
Change
Saudi Investors
Retail
162.19
164.73
2.54
High-Net-Worth Investors
269.95
266.65
(3.30)
Individual Professional Investors
481.05
471.41
(9.64)
Individual DPMs
17.40
17.16
(0.23)
Total (Retail)
930.59
919.96
(10.63)
Corporates
1661.38
1666.28
4.90
Mutual Funds
304.87
303.07
(1.81)
Government Entities
6043.45
6150.50
107.05
Institutional DPMs
77.68
76.58
(1.10)
Total (Corporate Investors)
8087.38
8196.43
109.05
Total (Saudi Investors)
9017.98
9116.39
98.42
GCC Investors
Individuals
5.09
5.04
(0.05)
Institutions
66.39
66.15
(0.24)
DPMs
3.97
3.89
(0.07)
Total (GCC Investors)
75.44
75.08
(0.36)
Foreign Investors
SWAP Holders
2.33
2.29
(0.04)
Foreign Residents
19.90
19.46
(0.43)
QFIs
365.43
363.99
(1.44)
DPMs
15.74
15.18
(0.56)
Strategic Partners
48.51
47.06
(1.45)
Total (Foreign Investors)
451.91
447.98
(3.93)
Total
9545.33
9639.45
94.12
Ownership Ratio by Nationality Investor Type
Investor Type
Oct. 16, 2025
Oct. 23, 2025
Change
Issued Shares
Free Float
Issued Shares
Free Float
Issued Shares
Free Float
Saudi Investors
Retail
1.70%
4.70%
1.71%
4.78%
0.01%
0.08%
High-Net-Worth Investors
2.83%
7.78%
2.77%
7.69%
(0.06%)
(0.09%)
Individual Professional Investors
5.04%
10.95%
4.89%
10.72%
(0.15%)
(0.23%)
Individual DPMs
0.18%
0.50%
0.18%
0.50%
—
(0.01%)
Total (Retail)
9.75%
23.93%
9.54%
23.68%
(0.21%)
(0.25%)
Corporates
17.41%
40.23%
17.29%
40.53%
(0.12%)
0.30%
Mutual Funds
3.19%
7.39%
3.14%
7.32%
(0.05%)
(0.07%)
Government Entities
63.31%
12.60%
63.81%
12.73%
0.49%
0.13%
Institutional DPMs
0.81%
2.15%
0.79%
2.12%
(0.02%)
(0.03%)
Total (Corporate Investors)
84.73%
62.37%
85.03%
62.70%
0.30%
0.33%
Total (Saudi Investors)
94.48%
86.30%
94.57%
86.39%
0.10%
0.09%
GCC Investors
Individuals
0.05%
0.15%
0.05%
0.15%
—
—
Institutions
0.70%
1.16%
0.69%
1.15%
(0.01%)
(0.01%)
DPMs
0.04%
0.12%
0.04%
0.12%
—
—
Total (GCC Investors)
0.79%
1.44%
0.78%
1.42%
(0.01%)
(0.01%)
Foreign Investors
SWAP Holders
0.02%
0.07%
0.02%
0.07%
—
—
Foreign Residents
0.21%
0.60%
0.20%
0.59%
(0.01%)
(0.01%)
QFIs
3.83%
11.11%
3.78%
11.07%
(0.05%)
(0.04%)
DPMs
0.16%
0.48%
0.16%
0.46%
(0.01%)
(0.02%)
Strategic Partners
0.51%
—
0.49%
—
(0.02%)
—
Total (Foreign Investors)
4.73%
12.26%
4.65%
12.19%
(0.09%)
(0.07%)
Ownership’s Value Ratio by Investor Type (SAR bln)
Investor Type
Oct. 16, 2025
Oct. 23, 2025
Change in Ownership
Equity
Issued Shares
Free Float
Equity
Issued Shares
Free Float
Institutional
9088.20
95.21%
86.76%
9183.57
95.27%
86.79%
95.36
Non-Institutional
457.13
4.79%
13.24%
455.88
4.73%
13.21%
(1.24)
Total
9545.33
100%
100%
9639.45
100%
100%
94.12