Foreign investors’ ownership at 4.85% of total market capital
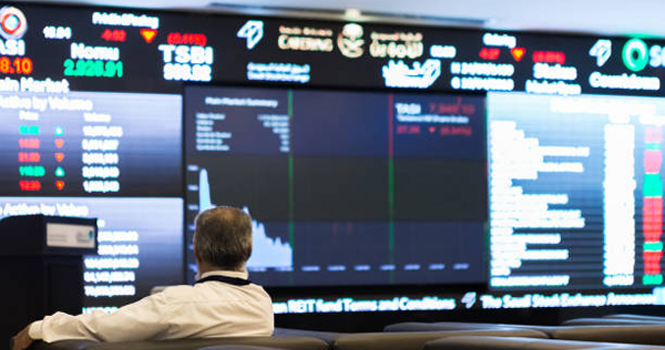
The market capitalization of the Saudi Exchange (Tadawul) fell 1.27%, or SAR 121.34 billion, week-on-week to about SAR 9.44 trillion in the week ended Feb. 5, according to data issued by Tadawul. 
Foreign investors’ ownership accounted for 4.85% of the total market capital.
Ownership Value by Nationality Investor Type (SAR bln)
Investor Type
Jan. 29, 2026
Feb. 5, 2026
Change
Saudi Investors
Retail
152.84
150.48
(2.36)
High-Net-Worth Investors
263.19
258.36
(4.83)
Individual Professional Investors
468.53
459.51
(9.02)
Individual DPMs
17.01
16.65
(0.36)
Total )Retail)
901.57
885.00
(16.57)
Corporates
1602.77
1580.65
(22.12)
Mutual Funds
291.26
285.90
(5.36)
Government Entities
6151.18
6084.63
(66.55)
Institutional DPMs
73.01
71.82
(1.19)
Total )Corporate Investors)
8118.22
8022.99
(95.23)
Total )Saudi Investors)
9019.79
8907.99
(111.80)
GCC Investors
Individuals
5.02
4.90
(0.12)
Institutions
70.43
68.98
(1.45)
DPMs
3.82
3.75
(0.07)
Total )GCC Investors)
79.27
77.63
(1.64)
Foreign Investors
SWAP Holders
11.27
10.32
(0.95)
Foreign Residents
385.94
380.76
(5.18)
Qualified Investors
2.39
2.18
(0.21)
DPMs
16.13
15.92
(0.21)
Strategic Partners
49.82
48.49
(1.33)
Total )Foreign Investors)
465.55
457.66
(7.89)
Total
9564.61
9443.27
(121.34)
Ownership Ratio by Nationality Investor Type*
Investor Type
Jan. 29, 2026
Feb. 5, 2026
Change
Issued Shares
Free Float
Issued Shares
Free Float
Issued Shares
Free Float
Saudi Investors
Retail
1.60 %
4.59 %
1.59 %
4.51 %
(0.01%)
(0.08%)
High-Net-Worth Investors
2.75 %
7.67 %
2.74 %
7.70 %
(0.02%)
0.03%
Individual Professional Investors
4.90 %
10.95 %
4.87 %
10.94 %
(0.03%)
(0.01%)
Individual DPMs
0.18 %
0.51 %
0.18 %
0.50 %
—
(0.01%)
Total )Retail)
9.43 %
23.72 %
9.37 %
23.65 %
(0.05%)
(0.07%)
Corporates
16.76 %
39.83 %
16.74 %
40.00 %
(0.02%)
0.18%
Mutual Funds
3.05 %
7.24 %
3.03 %
7.22 %
(0.02%)
(0.02%)
Government Entities
64.31 %
12.84 %
64.43 %
12.87 %
0.12%
0.03%
Institutional DPMs
0.76 %
2.07 %
0.76 %
2.08 %
—
0.01%
Total )Corporate Investors)
84.88 %
61.98 %
84.96 %
62.17 %
0.08%
0.19%
Total )Saudi Investors)
94.30 %
85.70 %
94.33 %
85.82 %
0.03%
0.11%
GCC Investors
Individuals
0.05 %
0.15 %
0.05 %
0.15 %
—
—
Institutions
0.74 %
1.26 %
0.73 %
1.26 %
(0.01%)
—
DPMs
0.04 %
0.12 %
0.04 %
0.12 %
—
—
Total )GCC Investors)
0.83 %
1.54 %
0.82 %
1.53 %
(0.01%)
(0.01%)
Foreign Investors
SWAP Holders
0.12 %
0.25 %
0.11 %
0.22%
(0.01%)
(0.03%)
Foreign Residents
4.04 %
11.94 %
4.03 %
11.86 %
(0.01%)
(0.08%)
Qualified Investors
0.03 %
0.07 %
0.02 %
0.07 %
(0.01%)
—
DPMs
0.17 %
0.50 %
0.17 %
0.50 %
—
—
Strategic Investors
0.52 %
—
0.51 %
—
(0.01%)
—
Total )Foreign Investors)
4.87%
12.76 %
4.85%
12.65 %
(0.02%)
(0.11%)
Ownership’s Value Ratio by Investor Classification (SAR bln)
Investor Type
Jan. 29, 2026
Feb. 5, 2026
Change in Ownership
Equity
Issued Shares
Free Float
Equity
Issued Shares
Free Float
Institutional
9132.29
95.48 %
87.33 %
9019.21
95.51 %
87.41 %
(113.08)
Non-Institutional
432.32
4.52 %
12.67 %
424.06
4.49 %
12.59 %
(8.26)
Total
9564.61
100 %
100 %
9443.27
100 %
100 %
(121.34)
Foreign investors’ ownership at 4.85% of total market capital
The market capitalization of the Saudi Exchange (Tadawul) fell 1.27%, or SAR 121.34 billion, week-on-week to about SAR 9.44 trillion in the week ended Feb. 5, according to data issued by Tadawul.
Foreign investors’ ownership accounted for 4.85% of the total market capital.
Ownership Value by Nationality Investor Type (SAR bln)
Investor Type
Jan. 29, 2026
Feb. 5, 2026
Change
Saudi Investors
Retail
152.84
150.48
(2.36)
High-Net-Worth Investors
263.19
258.36
(4.83)
Individual Professional Investors
468.53
459.51
(9.02)
Individual DPMs
17.01
16.65
(0.36)
Total )Retail)
901.57
885.00
(16.57)
Corporates
1602.77
1580.65
(22.12)
Mutual Funds
291.26
285.90
(5.36)
Government Entities
6151.18
6084.63
(66.55)
Institutional DPMs
73.01
71.82
(1.19)
Total )Corporate Investors)
8118.22
8022.99
(95.23)
Total )Saudi Investors)
9019.79
8907.99
(111.80)
GCC Investors
Individuals
5.02
4.90
(0.12)
Institutions
70.43
68.98
(1.45)
DPMs
3.82
3.75
(0.07)
Total )GCC Investors)
79.27
77.63
(1.64)
Foreign Investors
SWAP Holders
11.27
10.32
(0.95)
Foreign Residents
385.94
380.76
(5.18)
Qualified Investors
2.39
2.18
(0.21)
DPMs
16.13
15.92
(0.21)
Strategic Partners
49.82
48.49
(1.33)
Total )Foreign Investors)
465.55
457.66
(7.89)
Total
9564.61
9443.27
(121.34)
Ownership Ratio by Nationality Investor Type*
Investor Type
Jan. 29, 2026
Feb. 5, 2026
Change
Issued Shares
Free Float
Issued Shares
Free Float
Issued Shares
Free Float
Saudi Investors
Retail
1.60 %
4.59 %
1.59 %
4.51 %
(0.01%)
(0.08%)
High-Net-Worth Investors
2.75 %
7.67 %
2.74 %
7.70 %
(0.02%)
0.03%
Individual Professional Investors
4.90 %
10.95 %
4.87 %
10.94 %
(0.03%)
(0.01%)
Individual DPMs
0.18 %
0.51 %
0.18 %
0.50 %
—
(0.01%)
Total )Retail)
9.43 %
23.72 %
9.37 %
23.65 %
(0.05%)
(0.07%)
Corporates
16.76 %
39.83 %
16.74 %
40.00 %
(0.02%)
0.18%
Mutual Funds
3.05 %
7.24 %
3.03 %
7.22 %
(0.02%)
(0.02%)
Government Entities
64.31 %
12.84 %
64.43 %
12.87 %
0.12%
0.03%
Institutional DPMs
0.76 %
2.07 %
0.76 %
2.08 %
—
0.01%
Total )Corporate Investors)
84.88 %
61.98 %
84.96 %
62.17 %
0.08%
0.19%
Total )Saudi Investors)
94.30 %
85.70 %
94.33 %
85.82 %
0.03%
0.11%
GCC Investors
Individuals
0.05 %
0.15 %
0.05 %
0.15 %
—
—
Institutions
0.74 %
1.26 %
0.73 %
1.26 %
(0.01%)
—
DPMs
0.04 %
0.12 %
0.04 %
0.12 %
—
—
Total )GCC Investors)
0.83 %
1.54 %
0.82 %
1.53 %
(0.01%)
(0.01%)
Foreign Investors
SWAP Holders
0.12 %
0.25 %
0.11 %
0.22%
(0.01%)
(0.03%)
Foreign Residents
4.04 %
11.94 %
4.03 %
11.86 %
(0.01%)
(0.08%)
Qualified Investors
0.03 %
0.07 %
0.02 %
0.07 %
(0.01%)
—
DPMs
0.17 %
0.50 %
0.17 %
0.50 %
—
—
Strategic Investors
0.52 %
—
0.51 %
—
(0.01%)
—
Total )Foreign Investors)
4.87%
12.76 %
4.85%
12.65 %
(0.02%)
(0.11%)
Ownership’s Value Ratio by Investor Classification (SAR bln)
Investor Type
Jan. 29, 2026
Feb. 5, 2026
Change in Ownership
Equity
Issued Shares
Free Float
Equity
Issued Shares
Free Float
Institutional
9132.29
95.48 %
87.33 %
9019.21
95.51 %
87.41 %
(113.08)
Non-Institutional
432.32
4.52 %
12.67 %
424.06
4.49 %
12.59 %
(8.26)
Total
9564.61
100 %
100 %
9443.27
100 %
100 %
(121.34)