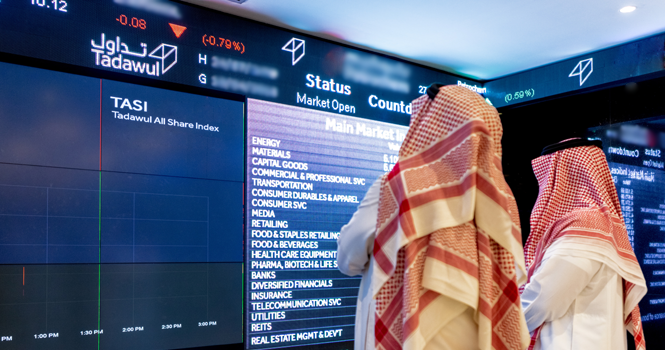
Tadawul trading screen
The market capitalization of the Saudi Exchange (Tadawul) was down 1.59%, or SAR 141.65 billion, week-on-week (WoW) to about SAR 8.766 trillion in the week ended Dec. 18, according to data issued by Tadawul.

Foreign investors’ ownership accounted for 4.72% of the total market capital.
Ownership Value by Nationality Investor Type (SAR bln)
Investor Type
Dec. 11, 2025
Dec. 18, 2025
Change
Saudi Investors
Retail
147.86
147.59
(0.27)
High-Net-Worth Investors
248.34
241.64
(6.70)
Individual Professional Investors
443.23
429.02
(14.21)
Individual DPMs
16.89
16.39
(0.49)
Total (Retail)
856.31
834.64
(21.67)
Corporates
1522.42
1492.95
(29.46)
Mutual Funds
278.83
271.37
(7.46)
Government Entities
5681.71
5613.61
(68.10)
Institutional DPMs
69.00
67.50
(1.50)
Total (Corporate Investors)
7551.95
7445.43
(106.52)
Total (Saudi Investors)
8408.26
8280.07
(128.19)
GCC Investors
Individuals
4.62
4.52
(0.10)
Institutions
65.42
64.12
(1.31)
DPMs
3.52
3.41
(0.11)
Total (GCC Investors)
73.56
72.05
(1.51)
Foreign Investors
SWAP Holders
2.14
2.10
(0.04)
Foreign Residents
18.67
18.42
(0.26)
QFIs
343.57
334.62
(8.95)
DPMs
14.74
13.72
(1.03)
Strategic Partners
46.90
45.23
(1.67)
Total (Foreign Investors)
426.03
414.09
(11.94)
Total
8907.85
8766.20
(141.65)
Ownership Ratio by Nationality Investor Type*
Investor Type
Dec. 11, 2025
Dec. 18, 2025
Change
Issued Shares
Free Float
Issued Shares
Free Float
Issued Shares
Free Float
Saudi Investors
Retail
1.66%
4.65%
1.68%
4.74%
0.02%
0.09%
High-Net-Worth Investors
2.79%
7.75%
2.76%
7.70%
(0.03%)
(0.05%)
Individual Professional Investors
4.98%
10.84%
4.89%
10.74%
(0.08%)
(0.11%)
Individual DPMs
0.19%
0.53%
0.19%
0.52%
—
—
Total (Retail)
9.61%
23.78%
9.52%
23.70%
(0.09%)
(0.07%)
Corporates
17.09%
40.15%
17.03%
40.29%
(0.06%)
0.14%
Mutual Funds
3.13%
7.35%
3.10%
7.30%
(0.03%)
(0.05%)
Government Entities
63.78%
12.64%
64.04%
12.71%
0.25%
0.07%
Institutional DPMs
0.77%
2.09%
0.77%
2.09%
—
—
Total (Corporate Investors)
84.78%
62.24%
84.93%
62.39%
0.15%
0.16%
Total (Saudi Investors)
94.39%
86.01%
94.45%
86.09%
0.06%
0.08%
GCC Investors
Individuals
0.05%
0.15%
0.05%
0.15%
—
—
Institutions
0.73%
1.24%
0.73%
1.23%
—
(0.01%)
DPMs
0.04%
0.12%
0.04%
0.11%
—
—
Total (GCC Investors)
0.83%
1.51%
0.82%
1.50%
—
(0.01%)
Foreign Investors
SWAP Holders
0.02%
0.07%
0.02%
0.07%
—
—
Foreign Residents
0.21%
0.61%
0.21%
0.61%
—
—
QFIs
3.86%
11.32%
3.82%
11.26%
(0.04%)
(0.06%)
DPMs
0.17%
0.49%
0.16%
0.46%
(0.01%)
(0.02%)
Strategic Partners
0.53%
—
0.52%
—
(0.01%)
—
Total (Foreign Investors)
4.78%
12.48%
4.72%
12.40%
(0.06%)
(0.08%)
Ownership’s Value Ratio by Investor Classification (SAR bln)
Investor Classification
Dec. 11, 2025
Dec. 18, 2025
Change in Ownership
Equity
Issued Shares
Free Float
Equity
Issued Shares
Free Float
Institutional
8488.37
95.29%
86.84%
8354.04
95.30%
86.79%
(134.34)
Non-Institutional
419.49
4.71%
13.16%
412.17
4.70%
13.21%
(7.32)
Total
8907.85
100%
100%
8766.20
100%
100%
(141.65)
Tadawul trading screen
The market capitalization of the Saudi Exchange (Tadawul) was down 1.59%, or SAR 141.65 billion, week-on-week (WoW) to about SAR 8.766 trillion in the week ended Dec. 18, according to data issued by Tadawul.
Foreign investors’ ownership accounted for 4.72% of the total market capital.
Ownership Value by Nationality Investor Type (SAR bln)
Investor Type
Dec. 11, 2025
Dec. 18, 2025
Change
Saudi Investors
Retail
147.86
147.59
(0.27)
High-Net-Worth Investors
248.34
241.64
(6.70)
Individual Professional Investors
443.23
429.02
(14.21)
Individual DPMs
16.89
16.39
(0.49)
Total (Retail)
856.31
834.64
(21.67)
Corporates
1522.42
1492.95
(29.46)
Mutual Funds
278.83
271.37
(7.46)
Government Entities
5681.71
5613.61
(68.10)
Institutional DPMs
69.00
67.50
(1.50)
Total (Corporate Investors)
7551.95
7445.43
(106.52)
Total (Saudi Investors)
8408.26
8280.07
(128.19)
GCC Investors
Individuals
4.62
4.52
(0.10)
Institutions
65.42
64.12
(1.31)
DPMs
3.52
3.41
(0.11)
Total (GCC Investors)
73.56
72.05
(1.51)
Foreign Investors
SWAP Holders
2.14
2.10
(0.04)
Foreign Residents
18.67
18.42
(0.26)
QFIs
343.57
334.62
(8.95)
DPMs
14.74
13.72
(1.03)
Strategic Partners
46.90
45.23
(1.67)
Total (Foreign Investors)
426.03
414.09
(11.94)
Total
8907.85
8766.20
(141.65)
Ownership Ratio by Nationality Investor Type*
Investor Type
Dec. 11, 2025
Dec. 18, 2025
Change
Issued Shares
Free Float
Issued Shares
Free Float
Issued Shares
Free Float
Saudi Investors
Retail
1.66%
4.65%
1.68%
4.74%
0.02%
0.09%
High-Net-Worth Investors
2.79%
7.75%
2.76%
7.70%
(0.03%)
(0.05%)
Individual Professional Investors
4.98%
10.84%
4.89%
10.74%
(0.08%)
(0.11%)
Individual DPMs
0.19%
0.53%
0.19%
0.52%
—
—
Total (Retail)
9.61%
23.78%
9.52%
23.70%
(0.09%)
(0.07%)
Corporates
17.09%
40.15%
17.03%
40.29%
(0.06%)
0.14%
Mutual Funds
3.13%
7.35%
3.10%
7.30%
(0.03%)
(0.05%)
Government Entities
63.78%
12.64%
64.04%
12.71%
0.25%
0.07%
Institutional DPMs
0.77%
2.09%
0.77%
2.09%
—
—
Total (Corporate Investors)
84.78%
62.24%
84.93%
62.39%
0.15%
0.16%
Total (Saudi Investors)
94.39%
86.01%
94.45%
86.09%
0.06%
0.08%
GCC Investors
Individuals
0.05%
0.15%
0.05%
0.15%
—
—
Institutions
0.73%
1.24%
0.73%
1.23%
—
(0.01%)
DPMs
0.04%
0.12%
0.04%
0.11%
—
—
Total (GCC Investors)
0.83%
1.51%
0.82%
1.50%
—
(0.01%)
Foreign Investors
SWAP Holders
0.02%
0.07%
0.02%
0.07%
—
—
Foreign Residents
0.21%
0.61%
0.21%
0.61%
—
—
QFIs
3.86%
11.32%
3.82%
11.26%
(0.04%)
(0.06%)
DPMs
0.17%
0.49%
0.16%
0.46%
(0.01%)
(0.02%)
Strategic Partners
0.53%
—
0.52%
—
(0.01%)
—
Total (Foreign Investors)
4.78%
12.48%
4.72%
12.40%
(0.06%)
(0.08%)
Ownership’s Value Ratio by Investor Classification (SAR bln)
Investor Classification
Dec. 11, 2025
Dec. 18, 2025
Change in Ownership
Equity
Issued Shares
Free Float
Equity
Issued Shares
Free Float
Institutional
8488.37
95.29%
86.84%
8354.04
95.30%
86.79%
(134.34)
Non-Institutional
419.49
4.71%
13.16%
412.17
4.70%
13.21%
(7.32)
Total
8907.85
100%
100%
8766.20
100%
100%
(141.65)