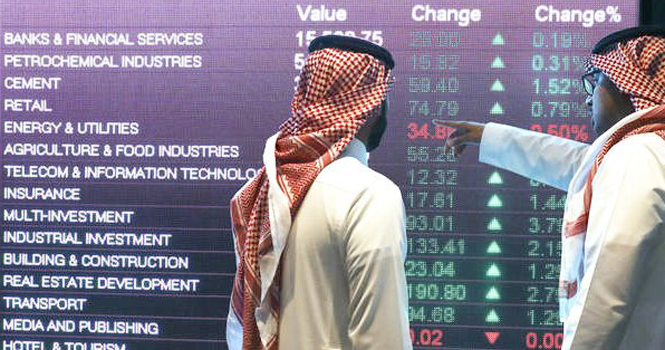
Tadawul trading screen
The market capitalization of the Saudi Exchange (Tadawul) fell 0.54%, or SAR 48.5 billion, week-on-week to about SAR 8.822 trillion in the week ended Sept. 4, according to data issued by Tadawul. 
Foreign investors’ ownership accounted for 4.55% of the total market capital.
Ownership Value by Nationality and Investor Type – (SAR bln)
Investor Type
Aug. 28, 2025
Sept. 4, 2025
Change
Saudi Investors
Retail
154.30
150.85
(3.45)
High-Net-Worth Investors
250.85
249.42
(1.43)
Individual Professional Investors
440.87
439.19
(1.68)
Individual DPMs
15.45
15.72
0.28
Total (Retail)
861.46
855.18
(6.28)
Corporates
1551.09
1538.25
(12.84)
Mutual Funds
278.17
276.48
(1.69)
Government Entities
5617.42
5608.10
(9.32)
Institutional DPMs
74.70
73.73
(0.96)
Total (Corporate Investors)
7521.38
7496.57
(24.81)
Total (Saudi Investors)
8382.84
8351.76
(31.09)
GCC Investors
Individuals
4.43
4.41
(0.02)
Institutions
62.07
61.17
(0.90)
DPMs
3.67
3.63
(0.04)
Total (GCC Investors)
70.17
69.21
(0.96)
Foreign Investors
SWAP Holders
2.12
2.12
—
Foreign Residents
17.60
17.66
0.06
QFIs
325.02
322.69
(2.33)
DPMs
13.39
13.33
(0.07)
Strategic Partners
47.45
45.90
(1.56)
Total (Foreign Investors)
405.59
401.70
(3.89)
Total
8858.61
8822.67
(35.94)
Ownership Ratio by Nationality Investor Type
Investor Type
Aug. 28, 2025
Sept. 4, 2025
Change
Issued Shares
Free Float
Issued Shares
Free Float
Issued Shares
Free Float
Saudi Investors
Retail
1.74%
4.86%
1.71%
4.79%
(0.03%)
(0.08%)
High-Net-Worth Investors
2.83%
7.85%
2.83%
7.85%
—
—
Individual Professional Investors
4.98%
10.91%
4.98%
%10.94
—
0.03%
Individual DPMs
0.17%
0.48%
0.18%
%0.50
—
0.01%
Total (Retail)
9.72%
24.10%
9.69%
24.07%
(0.03%)
(0.03%)
Corporates
17.51%
40.36%
17.44%
%40.41
(0.07%)
0.05%
Mutual Funds
3.14%
7.30%
3.13%
%7.29
(0.01%)
(0.01%)
Government Entities
63.41%
12.72%
63.56%
%12.74
0.15%
0.02%
Institutional DPMs
0.84%
2.24%
0.84%
%2.23
(0.01%)
(0.01%)
Total (Corporate Investors)
84.90%
62.62%
84.97%
%62.67
0.06%
0.05%
Total (Saudi Investors)
94.63%
86.73%
94.66%
86.74%
0.03%
0.02%
GCC Investors
Individuals
0.05%
0.15%
0.05%
0.15%
—
—
Institutions
0.70%
1.16%
%0.96
%1.15
(0.01%)
(0.01%)
DPMs
0.04%
0.12%
0.04%
0.12%
—
—
Total (GCC Investors)
0.79%
1.43%
0.78%
1.42%
(0.01%)
(0.01%)
Foreign Investors
SWAP Holders
0.02%
0.07%
0.02%
0.07%
—
—
Foreign Residents
0.20%
0.57%
0.20%
%0.58
—
0.01%
QFIs
3.67%
10.75%
%3.66
%10.74
(0.01%)
(0.02%)
DPMs
0.15%
0.44%
0.15%
0.44%
—
—
Strategic Partners
0.54%
—
%0.52
—
(0.02%)
—
Total (Foreign Investors)
4.58%
11.84%
4.55%
11.83%
(0.03%)
(0.01%)
Ownership’s Value Ratio by Investor Classification (SAR bln)
Investor Classification
Aug. 28, 2025
Sept. 4, 2025
Change in Ownership
Equity
Issued Shares
Free Float
Equity
Issued Shares
Free Float
Institutional
8431.43
95.18%
86.57%
8400.33
95.21%
86.64%
(31.10)
Non-Institutional
427.18
4.82%
13.43%
422.34
4.79%
13.36%
(4.84)
Total
8858.61
100%
100%
8822.67
100%
100%
(35.94)
Tadawul trading screen
The market capitalization of the Saudi Exchange (Tadawul) fell 0.54%, or SAR 48.5 billion, week-on-week to about SAR 8.822 trillion in the week ended Sept. 4, according to data issued by Tadawul.
Foreign investors’ ownership accounted for 4.55% of the total market capital.
Ownership Value by Nationality and Investor Type – (SAR bln)
Investor Type
Aug. 28, 2025
Sept. 4, 2025
Change
Saudi Investors
Retail
154.30
150.85
(3.45)
High-Net-Worth Investors
250.85
249.42
(1.43)
Individual Professional Investors
440.87
439.19
(1.68)
Individual DPMs
15.45
15.72
0.28
Total (Retail)
861.46
855.18
(6.28)
Corporates
1551.09
1538.25
(12.84)
Mutual Funds
278.17
276.48
(1.69)
Government Entities
5617.42
5608.10
(9.32)
Institutional DPMs
74.70
73.73
(0.96)
Total (Corporate Investors)
7521.38
7496.57
(24.81)
Total (Saudi Investors)
8382.84
8351.76
(31.09)
GCC Investors
Individuals
4.43
4.41
(0.02)
Institutions
62.07
61.17
(0.90)
DPMs
3.67
3.63
(0.04)
Total (GCC Investors)
70.17
69.21
(0.96)
Foreign Investors
SWAP Holders
2.12
2.12
—
Foreign Residents
17.60
17.66
0.06
QFIs
325.02
322.69
(2.33)
DPMs
13.39
13.33
(0.07)
Strategic Partners
47.45
45.90
(1.56)
Total (Foreign Investors)
405.59
401.70
(3.89)
Total
8858.61
8822.67
(35.94)
Ownership Ratio by Nationality Investor Type
Investor Type
Aug. 28, 2025
Sept. 4, 2025
Change
Issued Shares
Free Float
Issued Shares
Free Float
Issued Shares
Free Float
Saudi Investors
Retail
1.74%
4.86%
1.71%
4.79%
(0.03%)
(0.08%)
High-Net-Worth Investors
2.83%
7.85%
2.83%
7.85%
—
—
Individual Professional Investors
4.98%
10.91%
4.98%
%10.94
—
0.03%
Individual DPMs
0.17%
0.48%
0.18%
%0.50
—
0.01%
Total (Retail)
9.72%
24.10%
9.69%
24.07%
(0.03%)
(0.03%)
Corporates
17.51%
40.36%
17.44%
%40.41
(0.07%)
0.05%
Mutual Funds
3.14%
7.30%
3.13%
%7.29
(0.01%)
(0.01%)
Government Entities
63.41%
12.72%
63.56%
%12.74
0.15%
0.02%
Institutional DPMs
0.84%
2.24%
0.84%
%2.23
(0.01%)
(0.01%)
Total (Corporate Investors)
84.90%
62.62%
84.97%
%62.67
0.06%
0.05%
Total (Saudi Investors)
94.63%
86.73%
94.66%
86.74%
0.03%
0.02%
GCC Investors
Individuals
0.05%
0.15%
0.05%
0.15%
—
—
Institutions
0.70%
1.16%
%0.96
%1.15
(0.01%)
(0.01%)
DPMs
0.04%
0.12%
0.04%
0.12%
—
—
Total (GCC Investors)
0.79%
1.43%
0.78%
1.42%
(0.01%)
(0.01%)
Foreign Investors
SWAP Holders
0.02%
0.07%
0.02%
0.07%
—
—
Foreign Residents
0.20%
0.57%
0.20%
%0.58
—
0.01%
QFIs
3.67%
10.75%
%3.66
%10.74
(0.01%)
(0.02%)
DPMs
0.15%
0.44%
0.15%
0.44%
—
—
Strategic Partners
0.54%
—
%0.52
—
(0.02%)
—
Total (Foreign Investors)
4.58%
11.84%
4.55%
11.83%
(0.03%)
(0.01%)
Ownership’s Value Ratio by Investor Classification (SAR bln)
Investor Classification
Aug. 28, 2025
Sept. 4, 2025
Change in Ownership
Equity
Issued Shares
Free Float
Equity
Issued Shares
Free Float
Institutional
8431.43
95.18%
86.57%
8400.33
95.21%
86.64%
(31.10)
Non-Institutional
427.18
4.82%
13.43%
422.34
4.79%
13.36%
(4.84)
Total
8858.61
100%
100%
8822.67
100%
100%
(35.94)