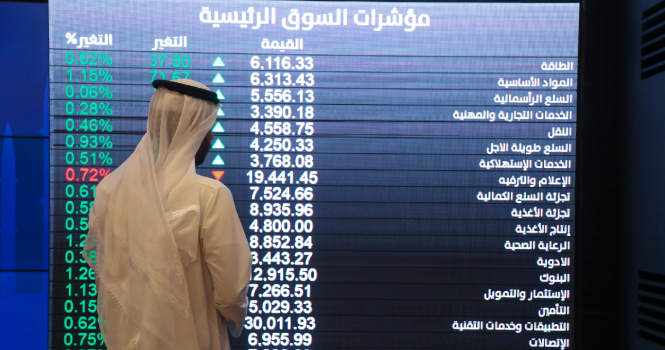
Tadawul trading screen
The market capitalization of the Saudi Exchange (Tadawul) fellby 0.88% (SAR 80.57 billion) month-on-month to about SAR 9.04 trillion inJuly. 
Foreign investors’ ownership accounted for 4.56% of the total market capitalfor the same month,according to monthly data issued by Tadawul.
Ownership Value by Nationality Investor Type (SAR bln)
Investor Type
June 30, 2025
July 31, 2025
Change
Saudi Investors
Retail
154.37
152.57
(1.80)
High-Net-Worth Investors
261.71
253.92
(7.79)
Individual Professional Investors
472.41
452.61
(19.80)
Individual DPMs
9.73
15.02
5.29
Total (Retail)
898.22
874.12
(24.10)
Corporates
1608.75
1571.79
(36.96)
Mutual Funds
297.52
284.69
(12.83)
Government Entities
5797.39
5758.59
(38.80)
Institutional DPMs
42.44
74.86
31.41
Total (Corporates)
7746.10
7689.92
(56.18)
Total (Saudi Investors)
8644.32
8564.05
(80.28)
GCC Investors
Individuals
4.17
4.31
0.14
Institutions
65.41
60.93
(4.49)
DPMs
0.57
3.79
3.21
Total (GCC Investors)
70.15
69.02
(1.13)
Foreign Investors
SWAP Holders
2.21
2.12
(0.09)
Foreign Residents
17.94
17.66
(0.28)
QFIs
331.24
330.33
(0.91)
DPMs
11.62
14.97
3.35
Strategic Partners
48.64
47.41
(1.23)
Total (Foreign Investors)
411.65
412.49
0.84
Total
9126.13
9045.56
(80.57)
Ownership Ratio by Nationality Investor Type
Investor Type
June 30, 2025
July 31, 2025
Change
Issued Shares
Free Float
Issued Shares
Free Float
Issued Shares
Free Float
Saudi Investors
Retail
1.69%
4.71%
1.69%
4.72%
—
0.02%
High-Net-Worth Investors
2.87%
7.92%
2.81%
7.80%
(0.6%)
(0.13%)
Individual Professional Investors
5.18%
11.28%
5.00%
10.94%
(0.17%)
(0.33%)
Individual DPMs
0.11%
0.29%
0.17%
0.46%
0.06%
0.17%
Total (Retail)
9.84%
24.20%
9.66%
23.92%
(0.18%)
(0.28%)
Corporates
17.63%
40.94%
17.38%
40.53%
(0.25%)
(0.41%)
Mutual Funds
3.26%
7.63%
3.15%
7.34%
(0.11%)
(0.29%)
Government Entities
63.53%
13.05%
63.66%
12.77%
0.14%
(0.28%)
Institutional DPMs
0.47 %
1.14 %
0.83%
2.17%
0.36%
1.03%
Total (Corporates)
84.88 %
62.76 %
85.01%
62.82%
0.13%
0.06%
Total (Saudi Investors)
94.72%
86.96 %
94.68%
86.74%
(0.4%)
(0.22%)
GCC Investors
Individuals
0.05 %
0.13%
0.05%
0.14%
—
0.01%
Institutions
0.72%
1.27%
0.67%
1.16%
(0.4%)
(0.12%)
DPMs
0.01%
0.02%
0.04%
0.12%
0.04%
0.10%
Total (GCC Investors)
0.77%
1.42%
0.76%
1.42%
(0.1%)
(0.1%)
Foreign Investors
SWAP Holders
0.02%
0.07%
0.02%
0.07%
—
—
Foreign Residents
0.20%
0.57%
0.20%
0.57%
—
—
QFIs
3.63%
10.61%
3.65%
10.72%
0.02%
0.11%
DPMs
0.13%
0.37%
0.17%
0.49%
0.04%
0.11%
Strategic Partners
0.53%
—
0.52%
—
(0.1%)
—
Total (Foreign Investors)
4.51%
11.62%
4.56%
11.84%
0.05%
0.22%
Ownership Value Ratio by Investor Classification (SAR bln)
Investor Classification
June 30, 2025
July 31, 2025
Change in Ownership
Equity
Issued Shares
Free Float
Equity
Issued Shares
Free Float
Institutional
8687.94
95.20 %
86.67 %
8617.09
95.26%
86.78%
(70.85)
Non-Institutional
438.19
4.80 %
13.33 %
428.47
4.74%
13.22%
(9.72)
Total
9126.13
100 %
100 %
9045.56
100 %
100 %
(80.57)
Tadawul trading screen
The market capitalization of the Saudi Exchange (Tadawul) fellby 0.88% (SAR 80.57 billion) month-on-month to about SAR 9.04 trillion inJuly.
Foreign investors’ ownership accounted for 4.56% of the total market capitalfor the same month,according to monthly data issued by Tadawul.
Ownership Value by Nationality Investor Type (SAR bln)
Investor Type
June 30, 2025
July 31, 2025
Change
Saudi Investors
Retail
154.37
152.57
(1.80)
High-Net-Worth Investors
261.71
253.92
(7.79)
Individual Professional Investors
472.41
452.61
(19.80)
Individual DPMs
9.73
15.02
5.29
Total (Retail)
898.22
874.12
(24.10)
Corporates
1608.75
1571.79
(36.96)
Mutual Funds
297.52
284.69
(12.83)
Government Entities
5797.39
5758.59
(38.80)
Institutional DPMs
42.44
74.86
31.41
Total (Corporates)
7746.10
7689.92
(56.18)
Total (Saudi Investors)
8644.32
8564.05
(80.28)
GCC Investors
Individuals
4.17
4.31
0.14
Institutions
65.41
60.93
(4.49)
DPMs
0.57
3.79
3.21
Total (GCC Investors)
70.15
69.02
(1.13)
Foreign Investors
SWAP Holders
2.21
2.12
(0.09)
Foreign Residents
17.94
17.66
(0.28)
QFIs
331.24
330.33
(0.91)
DPMs
11.62
14.97
3.35
Strategic Partners
48.64
47.41
(1.23)
Total (Foreign Investors)
411.65
412.49
0.84
Total
9126.13
9045.56
(80.57)
Ownership Ratio by Nationality Investor Type
Investor Type
June 30, 2025
July 31, 2025
Change
Issued Shares
Free Float
Issued Shares
Free Float
Issued Shares
Free Float
Saudi Investors
Retail
1.69%
4.71%
1.69%
4.72%
—
0.02%
High-Net-Worth Investors
2.87%
7.92%
2.81%
7.80%
(0.6%)
(0.13%)
Individual Professional Investors
5.18%
11.28%
5.00%
10.94%
(0.17%)
(0.33%)
Individual DPMs
0.11%
0.29%
0.17%
0.46%
0.06%
0.17%
Total (Retail)
9.84%
24.20%
9.66%
23.92%
(0.18%)
(0.28%)
Corporates
17.63%
40.94%
17.38%
40.53%
(0.25%)
(0.41%)
Mutual Funds
3.26%
7.63%
3.15%
7.34%
(0.11%)
(0.29%)
Government Entities
63.53%
13.05%
63.66%
12.77%
0.14%
(0.28%)
Institutional DPMs
0.47 %
1.14 %
0.83%
2.17%
0.36%
1.03%
Total (Corporates)
84.88 %
62.76 %
85.01%
62.82%
0.13%
0.06%
Total (Saudi Investors)
94.72%
86.96 %
94.68%
86.74%
(0.4%)
(0.22%)
GCC Investors
Individuals
0.05 %
0.13%
0.05%
0.14%
—
0.01%
Institutions
0.72%
1.27%
0.67%
1.16%
(0.4%)
(0.12%)
DPMs
0.01%
0.02%
0.04%
0.12%
0.04%
0.10%
Total (GCC Investors)
0.77%
1.42%
0.76%
1.42%
(0.1%)
(0.1%)
Foreign Investors
SWAP Holders
0.02%
0.07%
0.02%
0.07%
—
—
Foreign Residents
0.20%
0.57%
0.20%
0.57%
—
—
QFIs
3.63%
10.61%
3.65%
10.72%
0.02%
0.11%
DPMs
0.13%
0.37%
0.17%
0.49%
0.04%
0.11%
Strategic Partners
0.53%
—
0.52%
—
(0.1%)
—
Total (Foreign Investors)
4.51%
11.62%
4.56%
11.84%
0.05%
0.22%
Ownership Value Ratio by Investor Classification (SAR bln)
Investor Classification
June 30, 2025
July 31, 2025
Change in Ownership
Equity
Issued Shares
Free Float
Equity
Issued Shares
Free Float
Institutional
8687.94
95.20 %
86.67 %
8617.09
95.26%
86.78%
(70.85)
Non-Institutional
438.19
4.80 %
13.33 %
428.47
4.74%
13.22%
(9.72)
Total
9126.13
100 %
100 %
9045.56
100 %
100 %
(80.57)