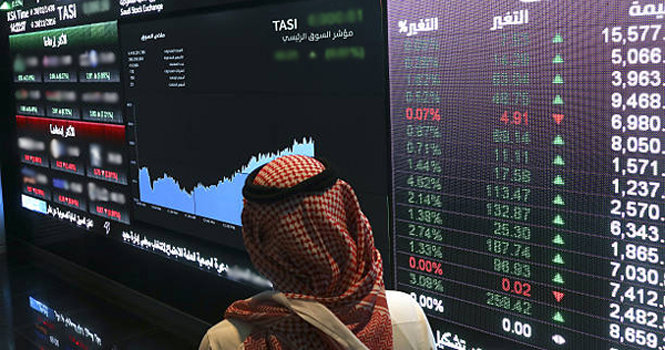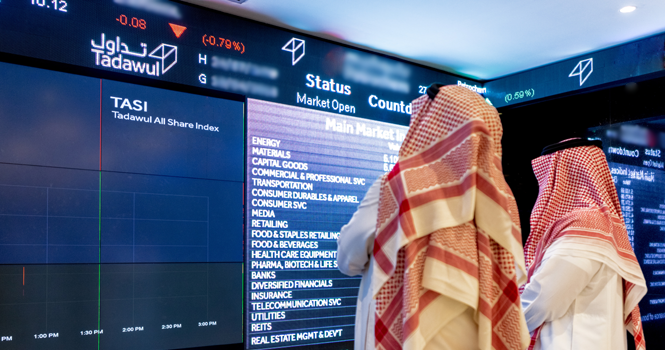
Tadawul trading screen
The market capitalization of the Saudi Exchange (Tadawul) fell by SAR 181.28 billion, 2.01% month-on-month (MoM) to about SAR 8.817 trillion in December, according to data issued by Tadawul. 
Foreign investors’ ownership accounted for 4.72% of the total market capital as of Dec. 31.
Ownership Value by Nationality Investor Type* (SAR bln)
Investor Type
Nov. 30, 2025
Dec. 31, 2025
Change
Saudi Investors
Retail
144.52
142.36
(2.16)
High-Net-Worth Investors
244.70
243.28
(1.42)
Individual Professional Investors
436.96
433.83
(3.13)
Individual DPMs
16.71
16.25
(0.46)
Total (Retail)
842.89
835.72
(7.17)
Corporates
1526.21
1494.58
(31.63)
Mutual Funds
273.46
272.56
(0.90)
Government Entities
5802.32
5657.33
(144.99)
Institutional DPMs
67.89
67.16
(0.73)
Total (Corporate Investors)
7669.88
7491.64
(178.25)
Total (Saudi Investors)
8512.77
8327.36
(185.42)
GCC Investors
Individuals
4.90
4.54
(0.36)
Institutions
62.11
65.92
3.81
DPMs
3.45
3.46
—
Total (GCC Investors)
70.46
73.92
3.46
Foreign Investors
SWAP Holders
2.11
1.04
(1.07)
Foreign Residents
18.12
18.04
(0.08)
QFIs
336.49
337.94
1.46
DPMs
14.07
13.68
(0.39)
Strategic Partners
44.86
45.62
0.76
Total (Foreign Investors)
415.65
416.33
(0.67)
Total
8998.89
8817.60
(181.28)
*Excluding corporate procedures
Ownership Ratio by Nationality Investor Type*
Investor Type
Nov. 30, 2025
Dec. 31, 2025
Change
Issued Shares
Free Float
Issued Shares
Free Float
Issued Shares
Free Float
Saudi Investors
Retail
1.61%
4.57%
1.61%
4.55%
0.01%
(0.02%)
High-Net-Worth Investors
2.72%
7.67%
2.76%
7.72%
0.04%
0.05%
Individual Professional Investors
4.86%
10.82%
4.92%
10.86%
0.06%
0.03%
Individual DPMs
0.19%
0.53%
0.18%
0.52%
—
(0.01%)
Total (Retail)
9.37%
23.59%
9.48%
23.65%
0.11%
0.06%
Corporates
16.96%
40.58%
16.95%
40.27%
(0.01%)
(0.32%)
Mutual Funds
3.04%
7.22%
3.09%
7.28%
0.05%
0.05%
Government Entities
64.48%
12.84%
64.16%
12.78%
(0.32%)
(0.06%)
Institutional DPMs
0.75%
2.07%
0.76%
2.07%
0.01%
—
Total (Corporate Investors)
85.23%
62.72%
84.96%
62.40%
(0.27%)
(0.32%)
Total (Saudi Investors)
94.60%
86.31%
94.44%
86.04%
(0.16%)
(0.26%)
GCC Investors
Individuals
0.05%
0.16%
0.05%
0.15%
—
(0.01%)
Institutions
0.69%
1.18%
0.75%
1.28%
0.06%
0.11%
DPMs
0.04%
0.11%
0.04%
0.12%
—
—
Total (GCC Investors)
0.78%
1.45%
0.84%
1.55%
0.06%
0.10%
Foreign Investors
SWAP Holders
0.02%
0.07%
0.01%
0.03%
(0.01%)
(0.03%)
Foreign Residents
0.20%
0.59%
0.20%
0.60%
—
0.01%
QFIs
3.74%
11.12%
3.83%
11.31%
0.09%
0.20%
DPMs
0.16%
0.46%
0.16%
0.46%
—
(0.01%)
Strategic Partners
0.50%
—
0.52%
—
0.02%
—
Total (Foreign Investors)
4.62%
12.24%
4.72%
12.40%
0.10%
0.16%
Ownership’s Value Ratio by Investor Classification (SAR bln)
Investor Classification
Nov. 30, 2025
Dec. 31, 2025
Change in Ownership
Equity
Issued Shares
Free Float
Equity
Issued Shares
Free Float
Institutional
8586.65
95.42%
87.00%
8409.38
95.37%
86.98%
(177.26)
Non-Institutional
412.24
4.58%
13.00%
408.22
4.63%
13.02%
(4.02)
Total
8998.89
100%
100%
8817.60
100%
100%
(181.28)
Tadawul trading screen
The market capitalization of the Saudi Exchange (Tadawul) fell by SAR 181.28 billion, 2.01% month-on-month (MoM) to about SAR 8.817 trillion in December, according to data issued by Tadawul.
Foreign investors’ ownership accounted for 4.72% of the total market capital as of Dec. 31.
Ownership Value by Nationality Investor Type* (SAR bln)
Investor Type
Nov. 30, 2025
Dec. 31, 2025
Change
Saudi Investors
Retail
144.52
142.36
(2.16)
High-Net-Worth Investors
244.70
243.28
(1.42)
Individual Professional Investors
436.96
433.83
(3.13)
Individual DPMs
16.71
16.25
(0.46)
Total (Retail)
842.89
835.72
(7.17)
Corporates
1526.21
1494.58
(31.63)
Mutual Funds
273.46
272.56
(0.90)
Government Entities
5802.32
5657.33
(144.99)
Institutional DPMs
67.89
67.16
(0.73)
Total (Corporate Investors)
7669.88
7491.64
(178.25)
Total (Saudi Investors)
8512.77
8327.36
(185.42)
GCC Investors
Individuals
4.90
4.54
(0.36)
Institutions
62.11
65.92
3.81
DPMs
3.45
3.46
—
Total (GCC Investors)
70.46
73.92
3.46
Foreign Investors
SWAP Holders
2.11
1.04
(1.07)
Foreign Residents
18.12
18.04
(0.08)
QFIs
336.49
337.94
1.46
DPMs
14.07
13.68
(0.39)
Strategic Partners
44.86
45.62
0.76
Total (Foreign Investors)
415.65
416.33
(0.67)
Total
8998.89
8817.60
(181.28)
*Excluding corporate procedures
Ownership Ratio by Nationality Investor Type*
Investor Type
Nov. 30, 2025
Dec. 31, 2025
Change
Issued Shares
Free Float
Issued Shares
Free Float
Issued Shares
Free Float
Saudi Investors
Retail
1.61%
4.57%
1.61%
4.55%
0.01%
(0.02%)
High-Net-Worth Investors
2.72%
7.67%
2.76%
7.72%
0.04%
0.05%
Individual Professional Investors
4.86%
10.82%
4.92%
10.86%
0.06%
0.03%
Individual DPMs
0.19%
0.53%
0.18%
0.52%
—
(0.01%)
Total (Retail)
9.37%
23.59%
9.48%
23.65%
0.11%
0.06%
Corporates
16.96%
40.58%
16.95%
40.27%
(0.01%)
(0.32%)
Mutual Funds
3.04%
7.22%
3.09%
7.28%
0.05%
0.05%
Government Entities
64.48%
12.84%
64.16%
12.78%
(0.32%)
(0.06%)
Institutional DPMs
0.75%
2.07%
0.76%
2.07%
0.01%
—
Total (Corporate Investors)
85.23%
62.72%
84.96%
62.40%
(0.27%)
(0.32%)
Total (Saudi Investors)
94.60%
86.31%
94.44%
86.04%
(0.16%)
(0.26%)
GCC Investors
Individuals
0.05%
0.16%
0.05%
0.15%
—
(0.01%)
Institutions
0.69%
1.18%
0.75%
1.28%
0.06%
0.11%
DPMs
0.04%
0.11%
0.04%
0.12%
—
—
Total (GCC Investors)
0.78%
1.45%
0.84%
1.55%
0.06%
0.10%
Foreign Investors
SWAP Holders
0.02%
0.07%
0.01%
0.03%
(0.01%)
(0.03%)
Foreign Residents
0.20%
0.59%
0.20%
0.60%
—
0.01%
QFIs
3.74%
11.12%
3.83%
11.31%
0.09%
0.20%
DPMs
0.16%
0.46%
0.16%
0.46%
—
(0.01%)
Strategic Partners
0.50%
—
0.52%
—
0.02%
—
Total (Foreign Investors)
4.62%
12.24%
4.72%
12.40%
0.10%
0.16%
Ownership’s Value Ratio by Investor Classification (SAR bln)
Investor Classification
Nov. 30, 2025
Dec. 31, 2025
Change in Ownership
Equity
Issued Shares
Free Float
Equity
Issued Shares
Free Float
Institutional
8586.65
95.42%
87.00%
8409.38
95.37%
86.98%
(177.26)
Non-Institutional
412.24
4.58%
13.00%
408.22
4.63%
13.02%
(4.02)
Total
8998.89
100%
100%
8817.60
100%
100%
(181.28)