The Kingdom of Saudi Arabia’s flag
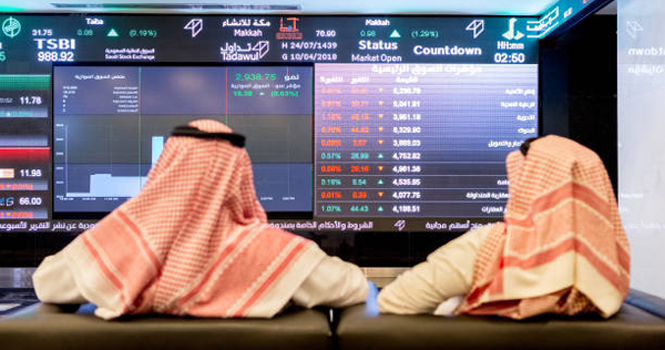
The seasonally adjusted Riyad Bank Saudi Arabia Purchasing Managers’ Index (PMI), formerly SP Global Saudi Arabia PMI, dropped to 57.4 points in December 2025, down 1.9% compared with the previous month. 
According to the report, the decline signaled a slowdown in non-oil private sector growth for the second consecutive month. Nonetheless, the index remained well above the neutral 50-point level and slightly above its long-term average of 56.9 points.
The report noted continued growth in business activity, new orders, and employment; however, the pace of expansion slowed, recording the weakest improvement in overall performance over the past four months.
At the same time, cost pressures intensified, leading to a marked increase in selling prices. Furthermore, business confidence for the year ahead declined amid concerns over rising market competition.
The report indicated that, as throughout 2025, non-oil companies recorded a notable increase in production levels in December.
Although this rise was the smallest in four months, it remained broadly in line with the long-term average.
Qualitative feedback suggested that companies were able to expand activity thanks to higher new business, ongoing projects, and increased investment spending.
The volume of new orders received by non-oil companies also rose sharply in December.
However, as with production, the pace of growth slowed to its weakest level since August.
Positive drivers included improved economic conditions, acquisition of new clients, initiation of new contracts, and successful marketing campaigns.
Nevertheless, some companies expressed concerns about market saturation, contributing to a slight slowdown in overall momentum.
Additionally, companies reported only a modest increase in new export orders compared with the previous month.
Saudi Arabia PMI since 2023*
Month
Index (Points)
Change (Points)
Change (%)
Jan. 2023
58.2
+1.3
+2.3%
February
59.8
+ 1.6
+2.7%
March
58.7
(1.1)
(%1.8)
April
59.6
+ 0.9
+1.5%
May
58.5
(1.1)
(%1.8)
June
59.6
+ 1.1
+1.9%
July
57.7
(1.9)
(%3.2 )
August
56.6
(1.1)
(%1.9)
September
57.2
+ 0.6
+1.1%
October
58.4
+ 1.2
+2.1%
November
57.5
(0.9)
(%1.5)
December
57.5
—
—
Jan. 2024
55.4
(2.1)
(%3.7)
February
57.2
+ 1.8
+3.2%
March
57
(0.2)
(%0.3)
April
57
—
—
May
56.4
(0.6)
(%1.1)
June
55
(1.4)
(%2.5)
July
54.4
(0.6)
(%1.1)
August
54.8
+ 0.4
+0.7%
September
56.3
+ 1.5
+2.7%
October
56.9
+ 0.6
+1.1%
November
59
+ 2.1
+3.7%
December
58.4
(0.6)
(%1.0)
Jan. 2025
60.5
+ 2.1
+3.6%
February
58.4
(2.1)
(%3.5)
March
58.1
(0.3)
(%0.5)
April
55.6
(2.5)
(%4.3)
May
55.8
+ 0.2
+0.4%
June
57.2
+ 1.4
+2.5%
July
56.3
(0.9)
(%1.6)
August
56.4
+ 0.1
(%0.2)
September
57.8
+ 1.4
+2.5%
October
60.2
+ 2.4
+4.2%
November
58.5
(1.7)
(2.8%)
December
57.4
(1.1)
(%1.9)
The PMI is a weighted average of the following five indices:
Riyad Bank PMI Details
Sub-index
Percentage (%)
New orders
30%
Production
25%
Employment
20%
Suppliers’ delivery times
15%
Stocks of purchases
10%
Total
100%
The Kingdom of Saudi Arabia’s flag
The seasonally adjusted Riyad Bank Saudi Arabia Purchasing Managers’ Index (PMI), formerly SP Global Saudi Arabia PMI, dropped to 57.4 points in December 2025, down 1.9% compared with the previous month.
According to the report, the decline signaled a slowdown in non-oil private sector growth for the second consecutive month. Nonetheless, the index remained well above the neutral 50-point level and slightly above its long-term average of 56.9 points.
The report noted continued growth in business activity, new orders, and employment; however, the pace of expansion slowed, recording the weakest improvement in overall performance over the past four months.
At the same time, cost pressures intensified, leading to a marked increase in selling prices. Furthermore, business confidence for the year ahead declined amid concerns over rising market competition.
The report indicated that, as throughout 2025, non-oil companies recorded a notable increase in production levels in December.
Although this rise was the smallest in four months, it remained broadly in line with the long-term average.
Qualitative feedback suggested that companies were able to expand activity thanks to higher new business, ongoing projects, and increased investment spending.
The volume of new orders received by non-oil companies also rose sharply in December.
However, as with production, the pace of growth slowed to its weakest level since August.
Positive drivers included improved economic conditions, acquisition of new clients, initiation of new contracts, and successful marketing campaigns.
Nevertheless, some companies expressed concerns about market saturation, contributing to a slight slowdown in overall momentum.
Additionally, companies reported only a modest increase in new export orders compared with the previous month.
Saudi Arabia PMI since 2023*
Month
Index (Points)
Change (Points)
Change (%)
Jan. 2023
58.2
+1.3
+2.3%
February
59.8
+ 1.6
+2.7%
March
58.7
(1.1)
(%1.8)
April
59.6
+ 0.9
+1.5%
May
58.5
(1.1)
(%1.8)
June
59.6
+ 1.1
+1.9%
July
57.7
(1.9)
(%3.2 )
August
56.6
(1.1)
(%1.9)
September
57.2
+ 0.6
+1.1%
October
58.4
+ 1.2
+2.1%
November
57.5
(0.9)
(%1.5)
December
57.5
—
—
Jan. 2024
55.4
(2.1)
(%3.7)
February
57.2
+ 1.8
+3.2%
March
57
(0.2)
(%0.3)
April
57
—
—
May
56.4
(0.6)
(%1.1)
June
55
(1.4)
(%2.5)
July
54.4
(0.6)
(%1.1)
August
54.8
+ 0.4
+0.7%
September
56.3
+ 1.5
+2.7%
October
56.9
+ 0.6
+1.1%
November
59
+ 2.1
+3.7%
December
58.4
(0.6)
(%1.0)
Jan. 2025
60.5
+ 2.1
+3.6%
February
58.4
(2.1)
(%3.5)
March
58.1
(0.3)
(%0.5)
April
55.6
(2.5)
(%4.3)
May
55.8
+ 0.2
+0.4%
June
57.2
+ 1.4
+2.5%
July
56.3
(0.9)
(%1.6)
August
56.4
+ 0.1
(%0.2)
September
57.8
+ 1.4
+2.5%
October
60.2
+ 2.4
+4.2%
November
58.5
(1.7)
(2.8%)
December
57.4
(1.1)
(%1.9)
The PMI is a weighted average of the following five indices:
Riyad Bank PMI Details
Sub-index
Percentage (%)
New orders
30%
Production
25%
Employment
20%
Suppliers’ delivery times
15%
Stocks of purchases
10%
Total
100%