The Kingdom of Saudi Arabia’s flag
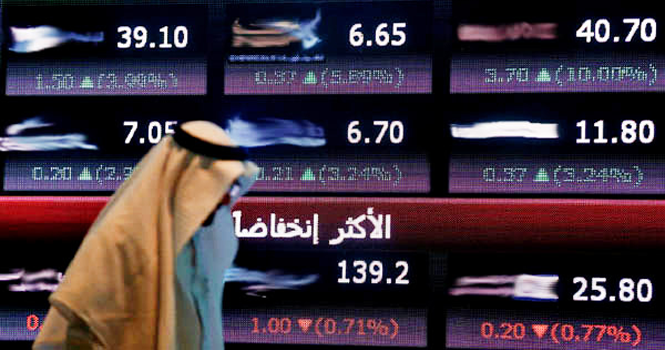
The seasonally adjusted Riyad Bank Saudi Arabia Purchasing Managers’ Index (PMI), formerly SP Global Saudi Arabia PMI, rose to 56.4 points in August 2025. 
Business conditions in the Kingdom’s non-oil private sector improved as business activity expanded at a slightly faster pace during the month compared to July, supported by a sharp rise in new orders. Employment levels also saw another historically strong increase, while purchasing activity grew in August, contributing to a further rise in input costs, which in turn led to higher selling prices.
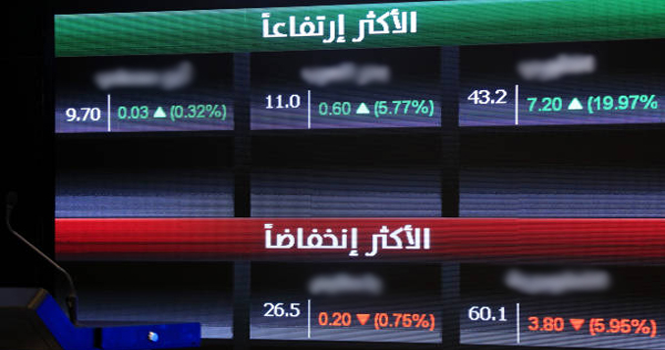
Production growth improved during August, with a notable overall hike. Businesses who responded to the study credited the rebound to improved economic conditions, increased sales volumes, and proactive marketing initiatives, despite the fact that it was only marginally better than July, the worst result in 72 months.
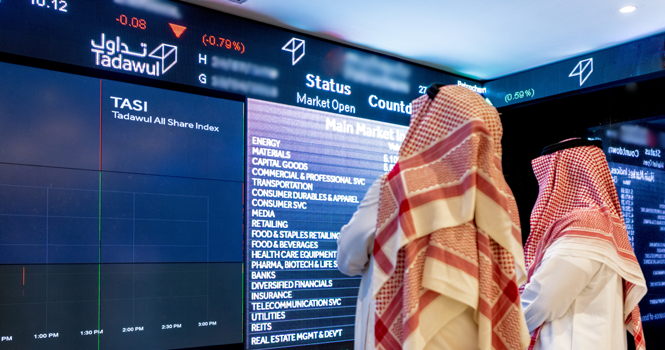
New order volumes saw a moderate uptick, partly due to a renewed increase in export sales. Companies specifically cited increased marketing efforts in international markets and closer collaboration with clients across the GCC region.
In addition, firms benefited from improved customer demand and ongoing domestic infrastructure projects. Around 28% of surveyed companies reported an increase in total new orders, nearly three times the proportion of those reporting a decline (9%).
Growth was particularly notable in the services sector.
Saudi Arabia PMI since 2023*
Month
Index (Points)
Change (Points)
Change (%)
Jan. 2023
58.2
+1.3
+2.3%
February
59.8
+1.6
+2.7%
March
58.7
(1.1)
(1.8%)
April
59.6
+0.9
+1.5%
May
58.5
(1.1)
(1.8%)
June
59.6
+1.1
+1.9%
July
57.7
(1.9)
(3.2%)
August
56.6
(1.1)
(1.9%)
September
57.2
+0.6
+1.1%
October
58.4
+1.2
+2.1%
November
57.5
(0.9)
(1.5%)
December
57.5
—
—
Jan. 2024
55.4
(2.1)
(3.7%)
February
57.2
+1.8
+3.2%
March
57.0
(0.2)
(0.3%)
April
57.0
—
—
May
56.4
(0.6)
(1.1%)
June
55.0
(1.4)
(2.5%)
July
54.4
(0.6)
(1.1%)
August
54.8
+0.4
+0.7%
September
56.3
+1.5
+2.7%
October
56.9
+0.6
+1.1%
November
59.0
+2.1
+3.7%
December
58.4
(0.6)
(1.0%)
Jan. 2025
60.5
+2.1
+3.6%
February
58.4
(2.1)
(3.5%)
March
58.1
(0.3)
(0.5%)
April
55.6
(2.5)
(4.3%)
May
55.8
+0.2
+0.4%
June
57.2
+1.4%
+2.5%
July
56.3
(0.9)
(1.6%)
August
56.4
+0.1%
(0.2%)
*Change on a monthly basis.
The PMI is a weighted average of the following five indices:
Riyad Bank PMI Details
Sub-index
Percentage (%)
New orders
30%
Production
25%
Employment
20%
Suppliers’ delivery times
15%
Stocks of purchases
10%
Total
100%
The Kingdom of Saudi Arabia’s flag
The seasonally adjusted Riyad Bank Saudi Arabia Purchasing Managers’ Index (PMI), formerly SP Global Saudi Arabia PMI, rose to 56.4 points in August 2025.
Business conditions in the Kingdom’s non-oil private sector improved as business activity expanded at a slightly faster pace during the month compared to July, supported by a sharp rise in new orders. Employment levels also saw another historically strong increase, while purchasing activity grew in August, contributing to a further rise in input costs, which in turn led to higher selling prices.
Production growth improved during August, with a notable overall hike. Businesses who responded to the study credited the rebound to improved economic conditions, increased sales volumes, and proactive marketing initiatives, despite the fact that it was only marginally better than July, the worst result in 72 months.
New order volumes saw a moderate uptick, partly due to a renewed increase in export sales. Companies specifically cited increased marketing efforts in international markets and closer collaboration with clients across the GCC region.
In addition, firms benefited from improved customer demand and ongoing domestic infrastructure projects. Around 28% of surveyed companies reported an increase in total new orders, nearly three times the proportion of those reporting a decline (9%).
Growth was particularly notable in the services sector.
Saudi Arabia PMI since 2023*
Month
Index (Points)
Change (Points)
Change (%)
Jan. 2023
58.2
+1.3
+2.3%
February
59.8
+1.6
+2.7%
March
58.7
(1.1)
(1.8%)
April
59.6
+0.9
+1.5%
May
58.5
(1.1)
(1.8%)
June
59.6
+1.1
+1.9%
July
57.7
(1.9)
(3.2%)
August
56.6
(1.1)
(1.9%)
September
57.2
+0.6
+1.1%
October
58.4
+1.2
+2.1%
November
57.5
(0.9)
(1.5%)
December
57.5
—
—
Jan. 2024
55.4
(2.1)
(3.7%)
February
57.2
+1.8
+3.2%
March
57.0
(0.2)
(0.3%)
April
57.0
—
—
May
56.4
(0.6)
(1.1%)
June
55.0
(1.4)
(2.5%)
July
54.4
(0.6)
(1.1%)
August
54.8
+0.4
+0.7%
September
56.3
+1.5
+2.7%
October
56.9
+0.6
+1.1%
November
59.0
+2.1
+3.7%
December
58.4
(0.6)
(1.0%)
Jan. 2025
60.5
+2.1
+3.6%
February
58.4
(2.1)
(3.5%)
March
58.1
(0.3)
(0.5%)
April
55.6
(2.5)
(4.3%)
May
55.8
+0.2
+0.4%
June
57.2
+1.4%
+2.5%
July
56.3
(0.9)
(1.6%)
August
56.4
+0.1%
(0.2%)
*Change on a monthly basis.
The PMI is a weighted average of the following five indices:
Riyad Bank PMI Details
Sub-index
Percentage (%)
New orders
30%
Production
25%
Employment
20%
Suppliers’ delivery times
15%
Stocks of purchases
10%
Total
100%