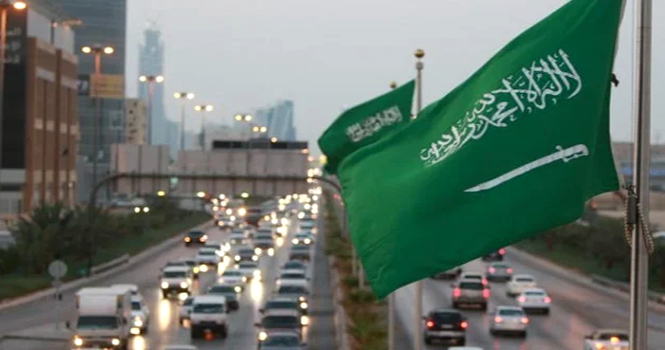
The Kingdom of Saudi Arabia’s flag

Saudi Arabia continued to lead the Middle East and North Africa (MENA) region in venture capital (VC) investment, accounting for 56% of total VC funding in the first half of 2025.
VC investment in the Kingdom reached approximately $860 million in H1 2025, surging 116% year-on-year (YoY) and surpassing the total VC investment recorded in 2024, according to a report by MAGNiTT, a platform specializing in startup data across the MENA region.
The number of VC deals in the Kingdom hit a record high of 114, up 31% YoY. This growth was supported by sustained sovereign capital activity, momentum from LEAP events, and early-stage programs backed by new venture funds and accelerators.
The UAE ranked second, attracting $447 million in VC investment, rising 84% YoY, across 114 deals.
The following table shows the number of VC deals and value:
Numberand Value of VCDeals Since 2018
Year
Number of Deals
Deals Value ($ mln)
Change
2018
56
59
—
2019
73
116
+97%
2020
93
154
+33%
2021
154
598
+282%
2022
161
1022
+74%
2023
153
1343
+31%
2024
178
750
(44%)
H1 2025
114
860
+116%
The Kingdom of Saudi Arabia’s flag
Saudi Arabia continued to lead the Middle East and North Africa (MENA) region in venture capital (VC) investment, accounting for 56% of total VC funding in the first half of 2025.
VC investment in the Kingdom reached approximately $860 million in H1 2025, surging 116% year-on-year (YoY) and surpassing the total VC investment recorded in 2024, according to a report by MAGNiTT, a platform specializing in startup data across the MENA region.
The number of VC deals in the Kingdom hit a record high of 114, up 31% YoY. This growth was supported by sustained sovereign capital activity, momentum from LEAP events, and early-stage programs backed by new venture funds and accelerators.
The UAE ranked second, attracting $447 million in VC investment, rising 84% YoY, across 114 deals.
The following table shows the number of VC deals and value:
Numberand Value of VCDeals Since 2018
Year
Number of Deals
Deals Value ($ mln)
Change
2018
56
59
—
2019
73
116
+97%
2020
93
154
+33%
2021
154
598
+282%
2022
161
1022
+74%
2023
153
1343
+31%
2024
178
750
(44%)
H1 2025
114
860
+116%