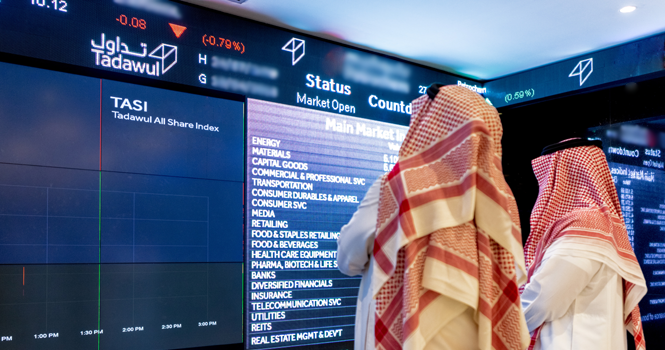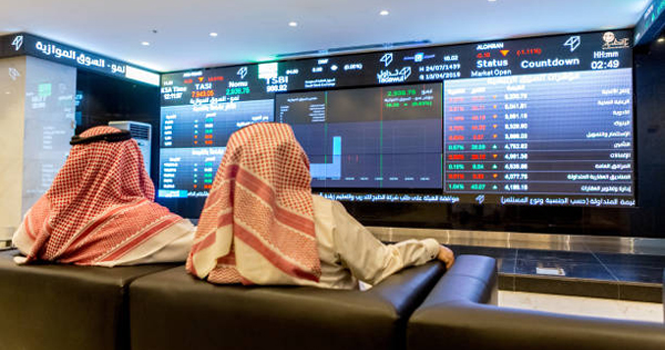
Tadawul trading screen
The number of individual investors on the Saudi Exchange (Tadawul) reached nearly 7.2 million by the end of 2025, an increase of 556,000 compared with the same period a year earlier. 
Malesaccounted for 5.35 million investors, whilefemaleinvestors amounted to 1.81 million, according to a recent report issued by the Capital Market Authority (CMA).
In addition, retail investor portfolios stood at nearly 14.6 million by the end of 2025.
The number of portfolios, which is more than twice the number of investors, indicates that some investors have more than one investment portfolio.
The following table shows the number of retail investors in listed companies since 2013:
Number of Retail Investors in Listed Companies (mln)
Period
Males
Females
Total
Number of Retail Investment Portfolios*
2013
3.47
0.87
4.33
7.75
2014
3.54
0.92
4.46
8.03
2015
3.60
0.95
4.55
8.67
2016
3.64
0.97
4.61
9.21
2017
3.68
0.99
4.67
9.37
2018
3.73
1.01
4.74
9.83
2019
4.12
1.35
5.48
9.86
2020
4.20
1.39
5.59
9.03
2021
4.35
1.52
5.86
10.33
2022
4.28
1.53
5.81
11.04
2023
4.55
1.59
6.15
11.04
2024
4.92
1.68
6.60
13.09
2025
5.35
1.81
7.16
14.57
*The existing portfolios, whether they contain shares or not.
Saudi individual investors in the domestic stock market owned SAR 835.8 billion worth of shares by the end of 2025, accounting for nearly 9.5% of the total market value of SAR 8.817 trillion.
Individual professional investors and high-net-worth investors (HNIs) owned stocks worth SAR 433.8 billion and SAR 243.3 billion, respectively.
The CMA defines HNIs as Saudi individuals who own a portfolio of an average size of SAR 1 million or more during the last 12 months, excluding individual professional investors.
Meanwhile, it defines the professional investors as Saudi individuals who own a portfolio of an average of SAR 50 million or more during the last 12 months, with a turnover rate of not more than 4x annually.
Ownership of government-related entities (GREs) in Saudi-listed companies, which accounted for 64.2% of the total market value, was down 14% year-on-year (YoY) to nearly SAR 5.65 trillion in 2025.
Saudi corporates’ ownership reached SAR 1.49 trillion, down 16% YoY, while mutual funds’ ownership stood at SAR 272.6 billion in the same period.
Meanwhile, qualified foreign investors (QFIs) owned SAR 337.9 billion worth of stocks by the end of 2025, with a slight rise of 0.4% YoY.
Ownership Value by Investor Type (SAR bln)
Item
2024
2025
Change
Saudis
High-Net-Worth Investors
272.1
243.3
(11%)
Retail
160.9
142.4
(11%)
Individual Professional Investors
502.1
433.8
(14%)
Individual DPMs
11.1
16.3
+47%
Corporates
1785.2
1494.6
(16%)
Mutual Funds
313.1
272.6
(13%)
Government Entities
6607.7
5657.3
(14%)
Institutional DPMs
49.7
67.2
+35%
GCC
Retail
4.3
4.5
+5%
Institutions
70.7
65.9
(7%)
DPMs
0.3
3.5
—
Foreign
Foreign Residents
2.4
1.0
(58%)
QFIs
17.5
18.0
+3%
Strategic Partners
339.4
337.9
(0.4%)
DPMs
50.1
45.6
(9%)
Foreign Residents
13.5
13.7
+1%
Total
10,200.1
8,817.6
(14%)
Tadawul trading screen
The number of individual investors on the Saudi Exchange (Tadawul) reached nearly 7.2 million by the end of 2025, an increase of 556,000 compared with the same period a year earlier.
Malesaccounted for 5.35 million investors, whilefemaleinvestors amounted to 1.81 million, according to a recent report issued by the Capital Market Authority (CMA).
In addition, retail investor portfolios stood at nearly 14.6 million by the end of 2025.
The number of portfolios, which is more than twice the number of investors, indicates that some investors have more than one investment portfolio.
The following table shows the number of retail investors in listed companies since 2013:
Number of Retail Investors in Listed Companies (mln)
Period
Males
Females
Total
Number of Retail Investment Portfolios*
2013
3.47
0.87
4.33
7.75
2014
3.54
0.92
4.46
8.03
2015
3.60
0.95
4.55
8.67
2016
3.64
0.97
4.61
9.21
2017
3.68
0.99
4.67
9.37
2018
3.73
1.01
4.74
9.83
2019
4.12
1.35
5.48
9.86
2020
4.20
1.39
5.59
9.03
2021
4.35
1.52
5.86
10.33
2022
4.28
1.53
5.81
11.04
2023
4.55
1.59
6.15
11.04
2024
4.92
1.68
6.60
13.09
2025
5.35
1.81
7.16
14.57
*The existing portfolios, whether they contain shares or not.
Saudi individual investors in the domestic stock market owned SAR 835.8 billion worth of shares by the end of 2025, accounting for nearly 9.5% of the total market value of SAR 8.817 trillion.
Individual professional investors and high-net-worth investors (HNIs) owned stocks worth SAR 433.8 billion and SAR 243.3 billion, respectively.
The CMA defines HNIs as Saudi individuals who own a portfolio of an average size of SAR 1 million or more during the last 12 months, excluding individual professional investors.
Meanwhile, it defines the professional investors as Saudi individuals who own a portfolio of an average of SAR 50 million or more during the last 12 months, with a turnover rate of not more than 4x annually.
Ownership of government-related entities (GREs) in Saudi-listed companies, which accounted for 64.2% of the total market value, was down 14% year-on-year (YoY) to nearly SAR 5.65 trillion in 2025.
Saudi corporates’ ownership reached SAR 1.49 trillion, down 16% YoY, while mutual funds’ ownership stood at SAR 272.6 billion in the same period.
Meanwhile, qualified foreign investors (QFIs) owned SAR 337.9 billion worth of stocks by the end of 2025, with a slight rise of 0.4% YoY.
Ownership Value by Investor Type (SAR bln)
Item
2024
2025
Change
Saudis
High-Net-Worth Investors
272.1
243.3
(11%)
Retail
160.9
142.4
(11%)
Individual Professional Investors
502.1
433.8
(14%)
Individual DPMs
11.1
16.3
+47%
Corporates
1785.2
1494.6
(16%)
Mutual Funds
313.1
272.6
(13%)
Government Entities
6607.7
5657.3
(14%)
Institutional DPMs
49.7
67.2
+35%
GCC
Retail
4.3
4.5
+5%
Institutions
70.7
65.9
(7%)
DPMs
0.3
3.5
—
Foreign
Foreign Residents
2.4
1.0
(58%)
QFIs
17.5
18.0
+3%
Strategic Partners
339.4
337.9
(0.4%)
DPMs
50.1
45.6
(9%)
Foreign Residents
13.5
13.7
+1%
Total
10,200.1
8,817.6
(14%)