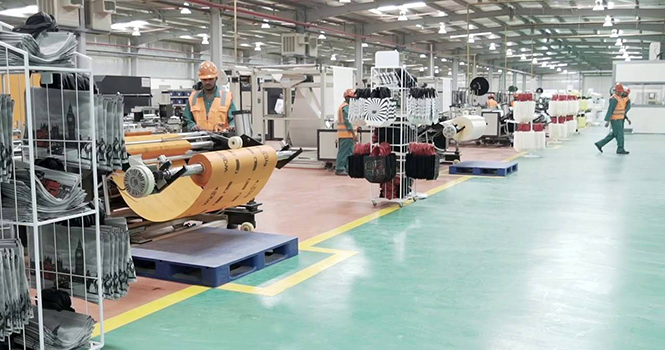
A view of the factory production line
Saudi Arabia’s Industrial Production Index (IPI) fell 23.5% to 87.1 points in August 2026 from 113.9 points a year ago, the General Authority for Statistics (GASTAT) said. 
GASTAT attributed the decline to lower output in mining and quarrying and manufacturing activities.
The IPI measures the relative change in production quantities of materials and goods, tracking their transformation from raw materials to final consumable products for economic returns.
Industrial Production Index (IPI)*
Period
IPI (Points)
Change (YoY)
January 2026
115.02
+11.2%
February
112.38
+14.8%
March
90.94
(16.0%)
April
83.72
(19.0%)
May
88.56
(18.1%)
June
92.10
(16.4%)
July
101.34
(8.3%)
August
87.11
(23.5%)
The mining and quarrying sub-index fell 35.8% year-on-year (YoY) in August. The manufacturing sub-index declined 8.8% YoY, weighed by a 24.1% drop in the manufacture of coke and refined petroleum products and a 3.3% decline in the manufacture of chemicals and chemical products.
The electricity, gas, steam and air conditioning sub-index rose 9.4% YoY in August. The sub-index for water supply, sewerage, waste management and treatment activities grew 7.4%.
IPI by Activity
Main Sectors
August 2025
August 2026
Change %
Mining Quarrying
106.63
68.42
(35.8%)
Manufacturing
123.32
112.52
(8.8%)
Electricity, Gas, Steam Air-Conditioning
150.52
164.69
9.4%
Water Supply, Sanitation, Waste Management Treatment Activities
133.15
143.00
7.4%
IPI
113.90
87.11
(23.5%)
A view of the factory production line
Saudi Arabia’s Industrial Production Index (IPI) fell 23.5% to 87.1 points in August 2026 from 113.9 points a year ago, the General Authority for Statistics (GASTAT) said.
GASTAT attributed the decline to lower output in mining and quarrying and manufacturing activities.
The IPI measures the relative change in production quantities of materials and goods, tracking their transformation from raw materials to final consumable products for economic returns.
Industrial Production Index (IPI)*
Period
IPI (Points)
Change (YoY)
January 2026
115.02
+11.2%
February
112.38
+14.8%
March
90.94
(16.0%)
April
83.72
(19.0%)
May
88.56
(18.1%)
June
92.10
(16.4%)
July
101.34
(8.3%)
August
87.11
(23.5%)
The mining and quarrying sub-index fell 35.8% year-on-year (YoY) in August. The manufacturing sub-index declined 8.8% YoY, weighed by a 24.1% drop in the manufacture of coke and refined petroleum products and a 3.3% decline in the manufacture of chemicals and chemical products.
The electricity, gas, steam and air conditioning sub-index rose 9.4% YoY in August. The sub-index for water supply, sewerage, waste management and treatment activities grew 7.4%.
IPI by Activity
Main Sectors
August 2025
August 2026
Change %
Mining Quarrying
106.63
68.42
(35.8%)
Manufacturing
123.32
112.52
(8.8%)
Electricity, Gas, Steam Air-Conditioning
150.52
164.69
9.4%
Water Supply, Sanitation, Waste Management Treatment Activities
133.15
143.00
7.4%
IPI
113.90
87.11
(23.5%)