


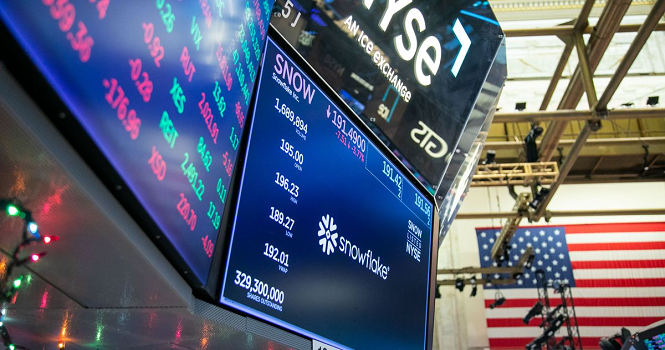
A screen displays US stock market trading activity.
Trading in US stock markets through Saudi capital market institutions hit a new record in Q2 2026, rising 56% to SAR 302.2 billion from approximately SAR 193.4 billion in the same period of 2025. 
According to the statistical bulletin issued by the Capital Market Authority (CMA), trading value increased 25%, or SAR 60.3 billion, from SAR 241.9 billion in Q1 2026, surpassing the previous record of SAR 253.9 billion set in Q4 2025.
Total trading in US markets reached approximately SAR 544 billion in H1 2026, compared with SAR 367.2 billion in the corresponding period of 2025, an increase of 48%.
The following table shows the trend in Saudi trading values in US markets:
Saudi Trading in US Stocks
Period
Value
(SAR bln)
YoY Change
Q1 2022
85.90
+10%
Q2 2022
147.44
+143%
Q3 2022
99.50
+96%
Q4 2022
50.35
+9%
Q1 2023
58.84
(31%)
Q2 2023
59.81
(59%)
Q3 2023
42.59
(57%)
Q4 2023
58.73
+17%
Q1 2024
62.31
+6%
Q2 2024
58.56
(2%)
Q3 2024
89.66
+111%
Q4 2024
102.18
+74%
Q1 2025
173.78
+179%
Q2 2025
193.40
+230%
Q3 2025
216.08
+141%
Q4 2025
253.86
+148%
Q1 2026
241.86
+39%
Q2 2026
302.18
+56%
US Markets Account for Nearly 97% of Overseas Trading
US markets accounted for approximately 96.8% of total overseas trading executed through Saudi capital market institutions in Q2 2026, which reached SAR 312.1 billion, compared with a share of 91.5% in Q1.
Notably, overseas trading through Saudi capital market institutions approached half the value of domestic market trading in Q2 2026, reaching SAR 312.1 billion, or 47.7% of domestic trading value of SAR 654.5 billion. US markets alone accounted for SAR 302.2 billion, or 46.2% of domestic trading value.
The following table shows the breakdown of overseas trading by geographic region:
Trading Values Executed by Capital Market Institutions in Overseas Markets in Q2 2026 (Buy and Sell Transactions)
Market
Value
(SAR mln)
Share
US
302,180
96.8%
Other
4,266
1.4%
European
3,112
1.0%
GCC
2,354
0.8%
Asian
183
0.1%
Arab
28
Less than 0.1%
Total
312,123
100.0%
It is worth noting that the CMA data cover trading values executed through licensed capital market institutions in Saudi Arabia and exclude transactions conducted directly by investors through foreign brokers. The data also do not disclose the number of Saudi investors or investment portfolios trading overseas.
Furthermore, the figures include both buy and sell transactions and do not represent net capital flows into overseas markets or reflect the value of assets held in those markets.
The CMA released draft regulations governing dealing activities in financial markets outside Saudi Arabia on Sept. 27, 2026, for public consultation until Oct. 27, aiming to strengthen the regulatory framework governing capital market institutions’ dealings with clients in overseas markets. The draft includes controls on margin transactions, most notably requiring clients to provide a margin of at least 50% of the transaction value and prohibiting such transactions in highly leveraged instruments or shares of companies whose accumulated losses exceed half their share capital. It also sets out requirements for assessing clients’ investment suitability.
A screen displays US stock market trading activity.
Trading in US stock markets through Saudi capital market institutions hit a new record in Q2 2026, rising 56% to SAR 302.2 billion from approximately SAR 193.4 billion in the same period of 2025.
According to the statistical bulletin issued by the Capital Market Authority (CMA), trading value increased 25%, or SAR 60.3 billion, from SAR 241.9 billion in Q1 2026, surpassing the previous record of SAR 253.9 billion set in Q4 2025.
Total trading in US markets reached approximately SAR 544 billion in H1 2026, compared with SAR 367.2 billion in the corresponding period of 2025, an increase of 48%.
The following table shows the trend in Saudi trading values in US markets:
Saudi Trading in US Stocks
Period
Value
(SAR bln)
YoY Change
Q1 2022
85.90
+10%
Q2 2022
147.44
+143%
Q3 2022
99.50
+96%
Q4 2022
50.35
+9%
Q1 2023
58.84
(31%)
Q2 2023
59.81
(59%)
Q3 2023
42.59
(57%)
Q4 2023
58.73
+17%
Q1 2024
62.31
+6%
Q2 2024
58.56
(2%)
Q3 2024
89.66
+111%
Q4 2024
102.18
+74%
Q1 2025
173.78
+179%
Q2 2025
193.40
+230%
Q3 2025
216.08
+141%
Q4 2025
253.86
+148%
Q1 2026
241.86
+39%
Q2 2026
302.18
+56%
US Markets Account for Nearly 97% of Overseas Trading
US markets accounted for approximately 96.8% of total overseas trading executed through Saudi capital market institutions in Q2 2026, which reached SAR 312.1 billion, compared with a share of 91.5% in Q1.
Notably, overseas trading through Saudi capital market institutions approached half the value of domestic market trading in Q2 2026, reaching SAR 312.1 billion, or 47.7% of domestic trading value of SAR 654.5 billion. US markets alone accounted for SAR 302.2 billion, or 46.2% of domestic trading value.
The following table shows the breakdown of overseas trading by geographic region:
Trading Values Executed by Capital Market Institutions in Overseas Markets in Q2 2026 (Buy and Sell Transactions)
Market
Value
(SAR mln)
Share
US
302,180
96.8%
Other
4,266
1.4%
European
3,112
1.0%
GCC
2,354
0.8%
Asian
183
0.1%
Arab
28
Less than 0.1%
Total
312,123
100.0%
It is worth noting that the CMA data cover trading values executed through licensed capital market institutions in Saudi Arabia and exclude transactions conducted directly by investors through foreign brokers. The data also do not disclose the number of Saudi investors or investment portfolios trading overseas.
Furthermore, the figures include both buy and sell transactions and do not represent net capital flows into overseas markets or reflect the value of assets held in those markets.
The CMA released draft regulations governing dealing activities in financial markets outside Saudi Arabia on Sept. 27, 2026, for public consultation until Oct. 27, aiming to strengthen the regulatory framework governing capital market institutions’ dealings with clients in overseas markets. The draft includes controls on margin transactions, most notably requiring clients to provide a margin of at least 50% of the transaction value and prohibiting such transactions in highly leveraged instruments or shares of companies whose accumulated losses exceed half their share capital. It also sets out requirements for assessing clients’ investment suitability.




