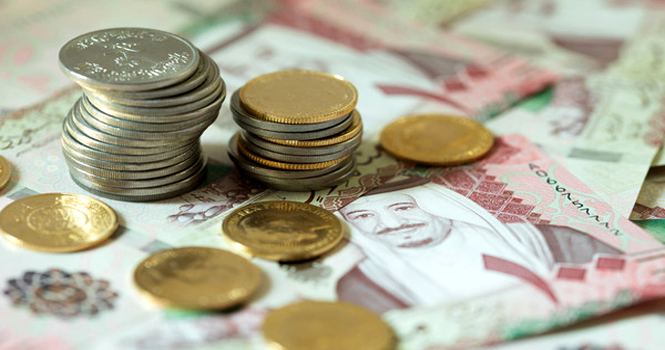
Saudi Arabian banknotes
An Argaam survey of TASI-listed companies showed that 66 companies reported losses in 2025, of which 65 paid board members remuneration, including salaries and allowances, during the same period. The remaining companies have yet to disclose their annual remuneration details. 
Saudi Basic Industries Corp. (SABIC) topped the list in terms of both losses and remuneration paid, reporting losses of approximately SAR 25.8 billion in 2025. Nevertheless, it paid board members SAR 48.4 million in remuneration and allowances, up 7% from approximately SAR 45.2 million a year earlier.
Saudi Research and Media Group (SRMG) ranked second in terms of remuneration, paying approximately SAR 36.4 million, down 15% year-on-year (YoY). It was followed by National Industrialization Co. (Tasnee), whose remuneration remained nearly unchanged YoY at SAR 35.6 million in 2025.
Meanwhile, Saudi Printing and Packaging Co. (SPPC) nearly doubled its remuneration in 2025, while remuneration paid to board members and executives at Cenomi Retail and Saudi Arabian Amiantit jumped 82% YoY and 65% YoY, respectively.
Board Remuneration and Salaries at Saudi Loss-Making Companies (SAR mln)
Company
Board Remuneration
2025 Loss
2025 Accumulated Loss
2024
2025
SABIC
45.2
48.4
(25,779.2)
—
SRMG
43.0
36.4
(366.3)
—
Tasnee
36.0
35.6
(1,765.3)
—
Sipchem
33.8
30.1
(860.5)
—
Tanmiah
23.7
29.3
(18.8)
—
Cenomi Retail
14.6
26.6
(505.5)
(2,112.9)
flynas
0.0
23.1
(527.0)
—
Emaar EC
16.8
21.3
(8.9)
—
SIIG
17.9
20.2
(103.7)
—
Southern Cement
15.5
18.0
(48.5)
—
Gulf Union Al Ahlia
15.9
17.5
(83.6)
(46.9)
Sinad Holding
19.2
14.7
(14.8)
—
Amiantit
8.8
14.5
(78.1)
—
Arabian Shield
10.4
14.1
(43.8)
—
Saudi Kayan
10.6
14.0
(2,293.9)
(5,900.2)
Knowledge City
15.7
13.9
(34.9)
(442.3)
Alandalus
13.1
13.9
(18.3)
—
Walaa
14.6
13.8
(175.8)
(58.0)
Arabian Drilling
13.9
12.9
(75.3)
—
Nayifat
10.5
12.3
(126.3)
—
L’azurde
13.0
11.6
(42.2)
—
Al Sagr Insurance
7.7
11.4
(70.3)
(41.5)
Jouf Cement
21.1
11.2
(206.6)
(130.8)
BAAN
9.5
10.9
(201.8)
(312.7)*
Takween
15.3
10.8
(202.0)
(500.4)
SVCP
10.3
10.3
(32.5)
(80.9)
Petro Rabigh
8.8
10.1
(3,898.7)
(9190.7)*
SPPC
4.9
9.7
(267.3)
(590.3)
Anaam Holding
9.0
8.9
(20.0)
(67.6)
ACIG
9.4
8.9
(41.2)
(133.6)
Chemanol
8.8
8.8
(479.7)
(551.3)
Alujain
9.3
8.7
(833.9)
—
UCA
9.1
8.5
(256.2)
(451.8)
Al-Etihad
9.1
7.9
(244.4)
(162.1)
Herfy
15.1
7.7
(77.5)
—
Red Sea International
5.7
7.6
(55.0)
(336.6)
AICC
6.7
7.6
(45.2)
(28.2)
Salama
9.4
7.6
(91.6)
(101.2)
Gulf General
9.0
7.4
(120.5)
(258.8)
Thimar
8.0
7.4
(13.0)
(94.7)
SAIC
13.1
7.2
(162.5)
—
Maadaniyah
7.2
6.9
(22.3)
(128.4)
SIDC
5.7
6.7
(89.1)
—
Tabuk Agricultural
8.3
6.4
(95.9)
(303.3)
FIPCO
6.0
6.2
(19.1)
—
Sadr
5.1
5.4
(3.4)
(11.9)
Enaya
6.9
5.2
(6.7)
(75.3)
Naseej
4.8
5.2
(34.0)
(94.0)
Shams
4.7
5.2
(11.5)
(80.1)
Wafrah
4.8
5.0
(46.8)
(39.6)
SARCO
1.8
4.2
(60.2)
—
Ash-Sharqiyah Development
4.8
4.1
(8.3)
—
Raydan
5.2
3.9
(64.7)
(56.0)
Arab Sea
4.3
3.9
(19.6)
(18.2)
Sadirat
4.3
3.6
(24.9)
(94.9)
Saudi Fisheries
3.2
3.1
(25.4)
(17.9)
Al-Omran
2.9
3.0
(8.3)
—
Entaj
7.6
2.7
(123.1)
—
Naqi
2.6
2.6
(2.7)
—
Tihama
3.6
2.5
(52.8)
(54.7)
Al Kathiri
2.2
2.5
(40.8)
(55.4)
Raoom
2.1
2.3
(4.6)
(6.3)
National Gypsum
3.9
2.3
(30.8)
(97.6)
Development Works
2.2
2.2
(5.2)
(12.6)
Amana
5.4
1.1
(13.3)
(187.8)
*Accumulated losses were offset as of June 30, 2026.
Saudi Arabian banknotes
An Argaam survey of TASI-listed companies showed that 66 companies reported losses in 2025, of which 65 paid board members remuneration, including salaries and allowances, during the same period. The remaining companies have yet to disclose their annual remuneration details.
Saudi Basic Industries Corp. (SABIC) topped the list in terms of both losses and remuneration paid, reporting losses of approximately SAR 25.8 billion in 2025. Nevertheless, it paid board members SAR 48.4 million in remuneration and allowances, up 7% from approximately SAR 45.2 million a year earlier.
Saudi Research and Media Group (SRMG) ranked second in terms of remuneration, paying approximately SAR 36.4 million, down 15% year-on-year (YoY). It was followed by National Industrialization Co. (Tasnee), whose remuneration remained nearly unchanged YoY at SAR 35.6 million in 2025.
Meanwhile, Saudi Printing and Packaging Co. (SPPC) nearly doubled its remuneration in 2025, while remuneration paid to board members and executives at Cenomi Retail and Saudi Arabian Amiantit jumped 82% YoY and 65% YoY, respectively.
Board Remuneration and Salaries at Saudi Loss-Making Companies (SAR mln)
Company
Board Remuneration
2025 Loss
2025 Accumulated Loss
2024
2025
SABIC
45.2
48.4
(25,779.2)
—
SRMG
43.0
36.4
(366.3)
—
Tasnee
36.0
35.6
(1,765.3)
—
Sipchem
33.8
30.1
(860.5)
—
Tanmiah
23.7
29.3
(18.8)
—
Cenomi Retail
14.6
26.6
(505.5)
(2,112.9)
flynas
0.0
23.1
(527.0)
—
Emaar EC
16.8
21.3
(8.9)
—
SIIG
17.9
20.2
(103.7)
—
Southern Cement
15.5
18.0
(48.5)
—
Gulf Union Al Ahlia
15.9
17.5
(83.6)
(46.9)
Sinad Holding
19.2
14.7
(14.8)
—
Amiantit
8.8
14.5
(78.1)
—
Arabian Shield
10.4
14.1
(43.8)
—
Saudi Kayan
10.6
14.0
(2,293.9)
(5,900.2)
Knowledge City
15.7
13.9
(34.9)
(442.3)
Alandalus
13.1
13.9
(18.3)
—
Walaa
14.6
13.8
(175.8)
(58.0)
Arabian Drilling
13.9
12.9
(75.3)
—
Nayifat
10.5
12.3
(126.3)
—
L’azurde
13.0
11.6
(42.2)
—
Al Sagr Insurance
7.7
11.4
(70.3)
(41.5)
Jouf Cement
21.1
11.2
(206.6)
(130.8)
BAAN
9.5
10.9
(201.8)
(312.7)*
Takween
15.3
10.8
(202.0)
(500.4)
SVCP
10.3
10.3
(32.5)
(80.9)
Petro Rabigh
8.8
10.1
(3,898.7)
(9190.7)*
SPPC
4.9
9.7
(267.3)
(590.3)
Anaam Holding
9.0
8.9
(20.0)
(67.6)
ACIG
9.4
8.9
(41.2)
(133.6)
Chemanol
8.8
8.8
(479.7)
(551.3)
Alujain
9.3
8.7
(833.9)
—
UCA
9.1
8.5
(256.2)
(451.8)
Al-Etihad
9.1
7.9
(244.4)
(162.1)
Herfy
15.1
7.7
(77.5)
—
Red Sea International
5.7
7.6
(55.0)
(336.6)
AICC
6.7
7.6
(45.2)
(28.2)
Salama
9.4
7.6
(91.6)
(101.2)
Gulf General
9.0
7.4
(120.5)
(258.8)
Thimar
8.0
7.4
(13.0)
(94.7)
SAIC
13.1
7.2
(162.5)
—
Maadaniyah
7.2
6.9
(22.3)
(128.4)
SIDC
5.7
6.7
(89.1)
—
Tabuk Agricultural
8.3
6.4
(95.9)
(303.3)
FIPCO
6.0
6.2
(19.1)
—
Sadr
5.1
5.4
(3.4)
(11.9)
Enaya
6.9
5.2
(6.7)
(75.3)
Naseej
4.8
5.2
(34.0)
(94.0)
Shams
4.7
5.2
(11.5)
(80.1)
Wafrah
4.8
5.0
(46.8)
(39.6)
SARCO
1.8
4.2
(60.2)
—
Ash-Sharqiyah Development
4.8
4.1
(8.3)
—
Raydan
5.2
3.9
(64.7)
(56.0)
Arab Sea
4.3
3.9
(19.6)
(18.2)
Sadirat
4.3
3.6
(24.9)
(94.9)
Saudi Fisheries
3.2
3.1
(25.4)
(17.9)
Al-Omran
2.9
3.0
(8.3)
—
Entaj
7.6
2.7
(123.1)
—
Naqi
2.6
2.6
(2.7)
—
Tihama
3.6
2.5
(52.8)
(54.7)
Al Kathiri
2.2
2.5
(40.8)
(55.4)
Raoom
2.1
2.3
(4.6)
(6.3)
National Gypsum
3.9
2.3
(30.8)
(97.6)
Development Works
2.2
2.2
(5.2)
(12.6)
Amana
5.4
1.1
(13.3)
(187.8)
*Accumulated losses were offset as of June 30, 2026.