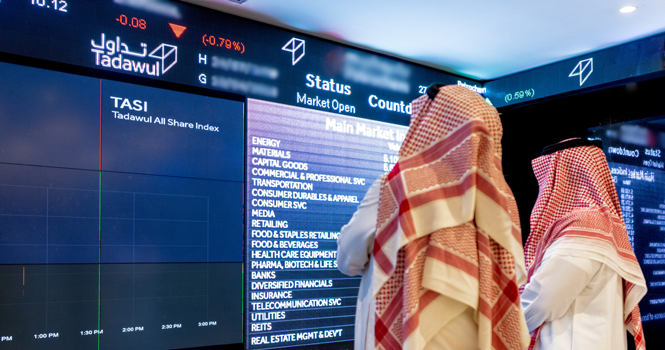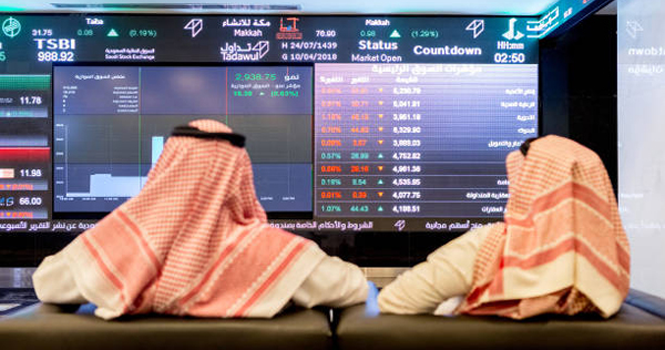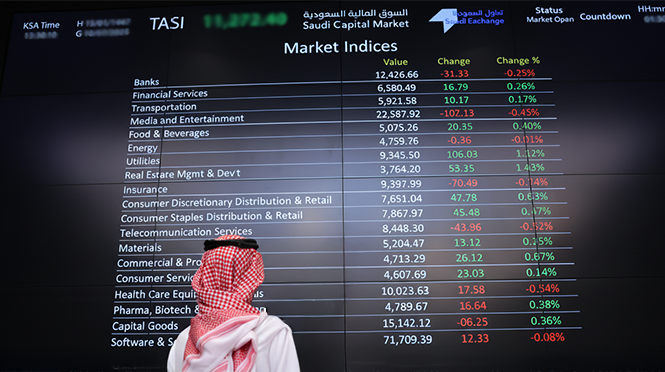
Tadawul trading screen
“Argaam tracking of IPO activity on the Saudi stock market showed a sharp decline in listings during the first eight months of 2026. The Main Market (TASI) and Nomu-Parallel Market recorded only three IPOs, with a total issue size of around SAR 522.5 million. 
This compares with 29 IPOs worth SAR 13.27 billion in the same period of 2025, representing a nearly 90% decline in the number of offerings and a 96% drop in their value.
TASI recorded only two IPOs worth a combined SAR 455.9 million, compared with nine IPOs worth SAR 12.41 billion in the first eight months of 2025.
Nomu recorded one IPO worth SAR 66.7 million, compared with 20 IPOs worth SAR 857.3 million during the corresponding period.
The following table shows IPO activity during the first eight months of each year from 2022 to 2026, in terms of the number of offerings and issue size.
IPO Activity: First 8 Months (2022–2026)
First 8 Months
TASI
Nomu
Total
IPOs
Issue Size
IPOs
Issue Size
IPOs
Issue Size
2020
2
3,059.88
1
30
3
3,089.88
2021
3
1,458
1
119.63
4
1,577.63
2022
10
15,782.74
10
939.495
20
16,722.24
2023
4
2,859.86
15
571.13
19
3,430.99
2024
7
7,346.45
15
635.95
22
7,982.40
2025
9
12,411.05
20
857.31
29
13,268.36
2026
2
455.85
1
66.67
3
522.52
The data showed clear differences across the years in terms of IPO numbers and funds raised, with the first eight months of 2022 recording the highest IPO proceeds during the comparison period at around SAR 16.72 billion, including SAR 15.78 billion on the Main Market and SAR 939.5 million on Nomu.
By contrast, 2025 recorded the highest number of IPOs in the first eight months, at 29, including nine on the Main Market and 20 on Nomu, but a higher number of IPOs did not necessarily translate into higher proceeds, with TASI accounting for the bulk of capital raised in years with large offerings, while Nomu was the main driver of growth in the number of IPOs.
Historical data also showed that some periods of higher IPO proceeds coincided with declines in trading value and TASI performance, as seen in 2022 and 2025. In 2022, IPO proceeds totaled around SAR 31.42 billion, while trading value fell 23% to an average of SAR 6.9 billion and the market index declined 7% year-on-year (YoY). In 2025, there were 14 IPOs worth around SAR 14.46 billion, while trading value fell 30% and the index declined 13% year-on-year.
In contrast, 2024 saw strong liquidity growth, with trading value rising 40% and trading volume increasing 105%, despite IPO proceeds totaling SAR 14.21 billion. Overall, the data show that IPO activity and liquidity movements coincided in some years, but do not establish a direct causal relationship given the multiple factors affecting market performance.
Although 2025 recorded average trading turnover of SAR 5.2 billion, and the TASI moved sideways in a pattern similar to that seen in 2026, the previous year saw 13 IPOs on TASI, compared with only two IPOs during the first eight months of this year.
Number of IPOs Issuance Size Historically for Full Year
Year
Number of TASI IPOs for the Full Year
Issuance Size
(SAR bln)
Average Trading Volume
(SAR bln)
December Market Close
2021
9
17.18
8.9
11281
2022
17
31.42
6.9
10478
2023
8
11.90
5.4
11967
2024
14
14.21
7.5
12036
2025
13
14.46
5.2
10490
8/2026
2
0.46
5.0
—
Tracking the performance of a number of companies that listed on the Main Market during 2025 reveals a clear gap between the strong demand seen during the subscription phase and the performance upon debut. Institutional coverage of the Etmam IPO, for example, reached approximately 208 times, yet the stock was trading at the end of August 2026 around 54% below its IPO price. Similarly, institutional coverage of Al Majdiah reached approximately 107 times, while the stock declined by around 53%.
These cases indicate that high institutional subscription coverage, although important in measuring demand during an IPO, was not in itself sufficient to predict the quality of the offering or the stock’s post-listing performance. Subsequent performance is affected by a number of factors, including pricing, which in some cases does not adequately take into account the future risks and challenges facing the sector or reflects an overly optimistic outlook for the sector’s prospects. These factors are subsequently reflected in the company’s financial results, valuation and market conditions following listing.
In terms of the performance of companies that went public in 2025 and 2026, the data showed a clear divergence between the strong demand seen for some IPOs and the performance of their shares following listing. Of the 37 companies that offered their shares during 2025 across the Main Market and the Nomu-Parallel Market, only seven generated positive returns through the end of August 2026, while 29 companies traded below their IPO prices.
Smile Care was the best-performing stock, rising 38% above its IPO price to SAR 6.06, followed by Al Masar Al Shamel, which gained 29%. Meanwhile, Time Entertainment recorded the largest decline among the companies monitored, falling 77% below its IPO price to close at SAR 18.68.
Among the 2026 IPOs, DBS gained approximately 21% above its IPO price, while Saleh Al Rashed declined by around 8%. MSGA, which is listed on Nomu, rose by about 4%.
Companies Listed During 2025 and 2026
Company
Offering Shares
(mln)
Offering Price
Issue Size
(SAR mln)
Institutional Investors Coverage
(x)
Retail Coverage
(%)
Closing (Aug. 31)
Change from IPO Price
TASI Subscriptions
2025
Derayah
49.95
30
1,498.41
162
1510%
22.54
(25%)
Entaj
9
50
450
208.4
3020%
23.00
(54%)
Masar
130.79
15
1,961.79
241
2000%
17.08
+14%
UCIC
12
50
600
126
890%
27.52
(45%)
flynas
51.26
80
4,100.45
100
350%
49.40
(38%)
SMC
75
25
1,875
64.7
145%
16.35
(35%)
Sport Clubs
34.32
7.5
257.4
44.1
534%
8.12
+8%
Build Station
4.8
85
408
9.67
200%
41.50
(51%)
Al Majdiah
90
14
1,260
107
278%
6.60
(53%)
Cherry
9
28
252
85.6
647%
23.99
(14%)
Al Masar Al Shamil
30.72
19.5
599.05
102.9
121%
25.18
+29%
CGS
30
10
300
61.6
(71%)
6.72
(33%)
Alramz
12.86
70
900
11.1
(36%)
49.88
(29%)
2026
Saleh Al Rashed
5.58
45
251.1
67.7
161%
41.22
(8%)
DBS
21
9.75
204.75
66.6
376%
11.84
+21%
Nomu Subscriptions
2025
Itmam
3
15
45
230%
14.88
(1%)
Alshehili
0.5
80
40
232%
51.00
(36%)
Smile Care
4
4.4
17.6
1981%
6.06
38%
Lamasat
6
5.75
34.5
1101%
4.20
(27%)
Hedab Alkhaleej
0.8
52
41.6
173%
29.70
(43%)
RATIO
5
10
50
865%
3.23
(68%)
Future Vision
2
3.5*
14
513%
3.47
(1%)
Service Equipment
0.72
84
60.48
147%
22.42
(73%)
Dkhoun
0.4
121
48.4
119%
58.00
(52%)
Adeer
1
85
85
680%
101.00
+19%
Axelerated
3
27
81
208%
22.95
(15%)
Al Kuzama
0.42
107
45.2
108%
46.00
(57%)
Asas Makeen
1
26.67*
80
1949%
19.01
(29%)
Anmat
5
9.5
47.5
286%
8.51
(10%)
Time Entertainment
0.2
80
16
141%
18.68
(77%
Hawiya
2.4
13
31.2
311%
13.00
—
Naf
0.4
7.6*
30.4
111%
8.80
+16%
SignWorld
1.5
12
18
109%
12.90
8%
Wajd Life
2.5
5.7
14.25
179%
5.02
(12%)
Hamad Bin Saedan
4.24
13.5
57.18
114%
9.00
(33%)
Jamjoom Fashion
2.38
145
345.73
450%
97.70
(33%)
Sahat Almajd
4.38
7
30.63
110%
6.22
(11%)
Altwijri
1
25
25
122%
17.02
(32%)
KDL
0.7
23
16.1
102%
13.90
(40%)
2026
MSGA
11.11
6
66.67
145%
6.25
+4%
*IPO price adjusted to reflect changes in nominal value and capital increases.
Amid the recent IPO activity and the performance of newly listed stocks, Mutlaq Al-Ghowairi Contracting and Al Diyar Al Arabia Real Estate Development announced the cancellation and postponement of their share offerings, respectively, in consultation with their financial advisers to assess the appropriate timing. Meanwhile, the six-month period granted to Alandalus Educational and Al Romansiah to complete their offerings and listings expired. Kesay Clinics also announced the postponement of its IPO on Nomu, while the period granted by the Capital Market Authority expired without the completion of the offering and listing procedures for Hamad Mohammed Al-Drees Partners for Industry and Mining, Sajda International and Al Rahden on Nomu.
Some sources had previously reported that CMA had contacted local and international investment banks to inquire about IPOs during 2025, including by reviewing pricing mechanisms, share allocations to investors and trading activity following listing, in an effort to strengthen investor confidence in the market.
The number of companies listed on Tadawul increased from 175 to 270 by the end of the second quarter of 2026.
Growth in TASI-listed Companies
Nomu was the fastest-growing market over the past ten years. The number of companies stood at only nine a decade ago, before rising to 125 companies by the end of Q2 2026, following the transfer of a number of companies to the TASI.
Growth in Nomu-listed Companies
CMA’s statistical bulletin for Q1 2026 revealed that the total number of outstanding listing applications in the Tadawul stood at 10 on the Main Market (TASI) at the end of Q1 2026, while Nomu had 23 outstanding applications, including registration applications submitted for the purpose of direct listing.
Tadawul trading screen
“Argaam tracking of IPO activity on the Saudi stock market showed a sharp decline in listings during the first eight months of 2026. The Main Market (TASI) and Nomu-Parallel Market recorded only three IPOs, with a total issue size of around SAR 522.5 million.
This compares with 29 IPOs worth SAR 13.27 billion in the same period of 2025, representing a nearly 90% decline in the number of offerings and a 96% drop in their value.
TASI recorded only two IPOs worth a combined SAR 455.9 million, compared with nine IPOs worth SAR 12.41 billion in the first eight months of 2025.
Nomu recorded one IPO worth SAR 66.7 million, compared with 20 IPOs worth SAR 857.3 million during the corresponding period.
The following table shows IPO activity during the first eight months of each year from 2022 to 2026, in terms of the number of offerings and issue size.
IPO Activity: First 8 Months (2022–2026)
First 8 Months
TASI
Nomu
Total
IPOs
Issue Size
IPOs
Issue Size
IPOs
Issue Size
2020
2
3,059.88
1
30
3
3,089.88
2021
3
1,458
1
119.63
4
1,577.63
2022
10
15,782.74
10
939.495
20
16,722.24
2023
4
2,859.86
15
571.13
19
3,430.99
2024
7
7,346.45
15
635.95
22
7,982.40
2025
9
12,411.05
20
857.31
29
13,268.36
2026
2
455.85
1
66.67
3
522.52
The data showed clear differences across the years in terms of IPO numbers and funds raised, with the first eight months of 2022 recording the highest IPO proceeds during the comparison period at around SAR 16.72 billion, including SAR 15.78 billion on the Main Market and SAR 939.5 million on Nomu.
By contrast, 2025 recorded the highest number of IPOs in the first eight months, at 29, including nine on the Main Market and 20 on Nomu, but a higher number of IPOs did not necessarily translate into higher proceeds, with TASI accounting for the bulk of capital raised in years with large offerings, while Nomu was the main driver of growth in the number of IPOs.
Historical data also showed that some periods of higher IPO proceeds coincided with declines in trading value and TASI performance, as seen in 2022 and 2025. In 2022, IPO proceeds totaled around SAR 31.42 billion, while trading value fell 23% to an average of SAR 6.9 billion and the market index declined 7% year-on-year (YoY). In 2025, there were 14 IPOs worth around SAR 14.46 billion, while trading value fell 30% and the index declined 13% year-on-year.
In contrast, 2024 saw strong liquidity growth, with trading value rising 40% and trading volume increasing 105%, despite IPO proceeds totaling SAR 14.21 billion. Overall, the data show that IPO activity and liquidity movements coincided in some years, but do not establish a direct causal relationship given the multiple factors affecting market performance.
Although 2025 recorded average trading turnover of SAR 5.2 billion, and the TASI moved sideways in a pattern similar to that seen in 2026, the previous year saw 13 IPOs on TASI, compared with only two IPOs during the first eight months of this year.
Number of IPOs Issuance Size Historically for Full Year
Year
Number of TASI IPOs for the Full Year
Issuance Size
(SAR bln)
Average Trading Volume
(SAR bln)
December Market Close
2021
9
17.18
8.9
11281
2022
17
31.42
6.9
10478
2023
8
11.90
5.4
11967
2024
14
14.21
7.5
12036
2025
13
14.46
5.2
10490
8/2026
2
0.46
5.0
—
Tracking the performance of a number of companies that listed on the Main Market during 2025 reveals a clear gap between the strong demand seen during the subscription phase and the performance upon debut. Institutional coverage of the Etmam IPO, for example, reached approximately 208 times, yet the stock was trading at the end of August 2026 around 54% below its IPO price. Similarly, institutional coverage of Al Majdiah reached approximately 107 times, while the stock declined by around 53%.
These cases indicate that high institutional subscription coverage, although important in measuring demand during an IPO, was not in itself sufficient to predict the quality of the offering or the stock’s post-listing performance. Subsequent performance is affected by a number of factors, including pricing, which in some cases does not adequately take into account the future risks and challenges facing the sector or reflects an overly optimistic outlook for the sector’s prospects. These factors are subsequently reflected in the company’s financial results, valuation and market conditions following listing.
In terms of the performance of companies that went public in 2025 and 2026, the data showed a clear divergence between the strong demand seen for some IPOs and the performance of their shares following listing. Of the 37 companies that offered their shares during 2025 across the Main Market and the Nomu-Parallel Market, only seven generated positive returns through the end of August 2026, while 29 companies traded below their IPO prices.
Smile Care was the best-performing stock, rising 38% above its IPO price to SAR 6.06, followed by Al Masar Al Shamel, which gained 29%. Meanwhile, Time Entertainment recorded the largest decline among the companies monitored, falling 77% below its IPO price to close at SAR 18.68.
Among the 2026 IPOs, DBS gained approximately 21% above its IPO price, while Saleh Al Rashed declined by around 8%. MSGA, which is listed on Nomu, rose by about 4%.
Companies Listed During 2025 and 2026
Company
Offering Shares
(mln)
Offering Price
Issue Size
(SAR mln)
Institutional Investors Coverage
(x)
Retail Coverage
(%)
Closing (Aug. 31)
Change from IPO Price
TASI Subscriptions
2025
Derayah
49.95
30
1,498.41
162
1510%
22.54
(25%)
Entaj
9
50
450
208.4
3020%
23.00
(54%)
Masar
130.79
15
1,961.79
241
2000%
17.08
+14%
UCIC
12
50
600
126
890%
27.52
(45%)
flynas
51.26
80
4,100.45
100
350%
49.40
(38%)
SMC
75
25
1,875
64.7
145%
16.35
(35%)
Sport Clubs
34.32
7.5
257.4
44.1
534%
8.12
+8%
Build Station
4.8
85
408
9.67
200%
41.50
(51%)
Al Majdiah
90
14
1,260
107
278%
6.60
(53%)
Cherry
9
28
252
85.6
647%
23.99
(14%)
Al Masar Al Shamil
30.72
19.5
599.05
102.9
121%
25.18
+29%
CGS
30
10
300
61.6
(71%)
6.72
(33%)
Alramz
12.86
70
900
11.1
(36%)
49.88
(29%)
2026
Saleh Al Rashed
5.58
45
251.1
67.7
161%
41.22
(8%)
DBS
21
9.75
204.75
66.6
376%
11.84
+21%
Nomu Subscriptions
2025
Itmam
3
15
45
230%
14.88
(1%)
Alshehili
0.5
80
40
232%
51.00
(36%)
Smile Care
4
4.4
17.6
1981%
6.06
38%
Lamasat
6
5.75
34.5
1101%
4.20
(27%)
Hedab Alkhaleej
0.8
52
41.6
173%
29.70
(43%)
RATIO
5
10
50
865%
3.23
(68%)
Future Vision
2
3.5*
14
513%
3.47
(1%)
Service Equipment
0.72
84
60.48
147%
22.42
(73%)
Dkhoun
0.4
121
48.4
119%
58.00
(52%)
Adeer
1
85
85
680%
101.00
+19%
Axelerated
3
27
81
208%
22.95
(15%)
Al Kuzama
0.42
107
45.2
108%
46.00
(57%)
Asas Makeen
1
26.67*
80
1949%
19.01
(29%)
Anmat
5
9.5
47.5
286%
8.51
(10%)
Time Entertainment
0.2
80
16
141%
18.68
(77%
Hawiya
2.4
13
31.2
311%
13.00
—
Naf
0.4
7.6*
30.4
111%
8.80
+16%
SignWorld
1.5
12
18
109%
12.90
8%
Wajd Life
2.5
5.7
14.25
179%
5.02
(12%)
Hamad Bin Saedan
4.24
13.5
57.18
114%
9.00
(33%)
Jamjoom Fashion
2.38
145
345.73
450%
97.70
(33%)
Sahat Almajd
4.38
7
30.63
110%
6.22
(11%)
Altwijri
1
25
25
122%
17.02
(32%)
KDL
0.7
23
16.1
102%
13.90
(40%)
2026
MSGA
11.11
6
66.67
145%
6.25
+4%
*IPO price adjusted to reflect changes in nominal value and capital increases.
Amid the recent IPO activity and the performance of newly listed stocks, Mutlaq Al-Ghowairi Contracting and Al Diyar Al Arabia Real Estate Development announced the cancellation and postponement of their share offerings, respectively, in consultation with their financial advisers to assess the appropriate timing. Meanwhile, the six-month period granted to Alandalus Educational and Al Romansiah to complete their offerings and listings expired. Kesay Clinics also announced the postponement of its IPO on Nomu, while the period granted by the Capital Market Authority expired without the completion of the offering and listing procedures for Hamad Mohammed Al-Drees Partners for Industry and Mining, Sajda International and Al Rahden on Nomu.
Some sources had previously reported that CMA had contacted local and international investment banks to inquire about IPOs during 2025, including by reviewing pricing mechanisms, share allocations to investors and trading activity following listing, in an effort to strengthen investor confidence in the market.
The number of companies listed on Tadawul increased from 175 to 270 by the end of the second quarter of 2026.
Growth in TASI-listed Companies
Nomu was the fastest-growing market over the past ten years. The number of companies stood at only nine a decade ago, before rising to 125 companies by the end of Q2 2026, following the transfer of a number of companies to the TASI.
Growth in Nomu-listed Companies
CMA’s statistical bulletin for Q1 2026 revealed that the total number of outstanding listing applications in the Tadawul stood at 10 on the Main Market (TASI) at the end of Q1 2026, while Nomu had 23 outstanding applications, including registration applications submitted for the purpose of direct listing.