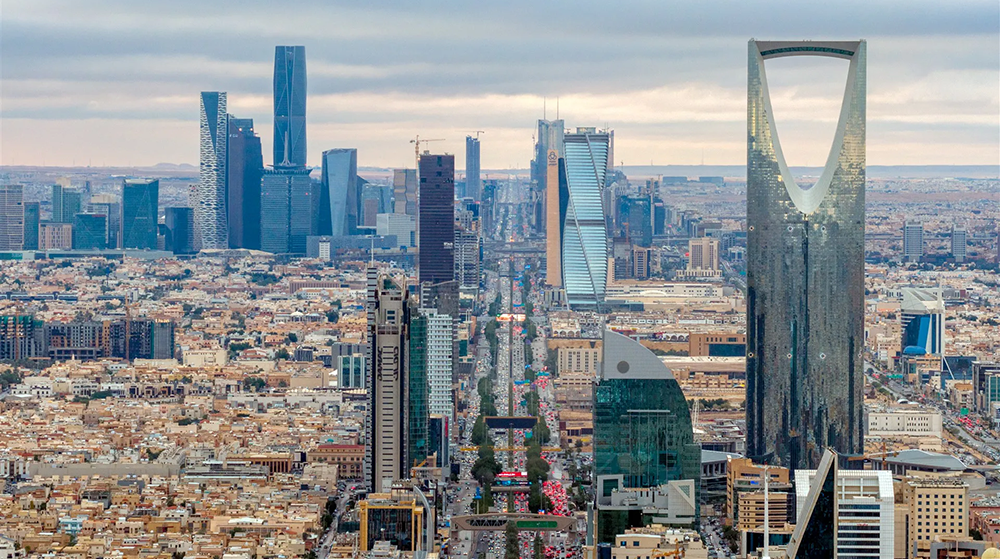
Riyadh city
The hotel room occupancy rate in Saudi Arabia declined to 60.8% in Q1 2026, compared to 63% in the same period of 2025. 
Meanwhile, the occupancy rate for serviced apartments and other hospitality facilities inched up to 51.6%, up from 50.7% a year earlier, according to the General Authority for Statistics (GASTAT) Tourism Establishments Statistics Bulletin.
Occupancy Rates for Hotels, Serviced Apartments Others
Period
Hotels (%)
Serviced Apts Others
Q1 2023
63.2%
53.0%
Q2
54.9%
50.9%
Q3
53.4%
56.2%
Q4
60.2%
55.4%
Q1 2024
60.9%
54.5%
Q2
55.4%
52.4%
Q3
46.1%
58.0%
Q4
56.0%
55.9%
Q1 2025
63.0%
50.7%
Q2
53.2%
50.2%
Q3
49.1%
57.4%
Q4
57.3%
55.9%
Q1 2026
60.8%
51.6%
Across regions, hotel and serviced apartment occupancy rates varied significantly. Madinah recorded the highest hotel occupancy rate at 82.5%, followed by Makkah at 59.5% and Riyadh at 50.6%.
Meanwhile, Najran posted the highest occupancy rate for serviced apartments and other hospitality facilities at 60.2%, followed by Riyadh at 59.3% and Madinah at 55.8%.
On the other hand, Al Baha recorded the lowest occupancy rates for both hotels (26.2%) and serviced apartments (27.6%).
Room occupancy rate by region
Region
Hotels
Serviced apartments
Madinah
82.5%
55.8%
Makkah
59.5%
49.6%
Riyadh
50.6%
59.3%
Eastern Region
49.5%
52.0%
Northern Borders
46.5%
37.6%
Qassim
45.9%
53.2%
Jazan
41.0%
47.7%
Al Jouf
39.9%
40.9%
Hail
39.4%
50.7%
Najran
41.5%
60.2%
Tabuk
27.5%
38.5%
Aseer
27.3%
39.3%
Al Baha
26.2%
27.6%
The average daily room rate (ADR) for hotels stood at SAR 423 in Q1 2026, down 11.4% from Q1 2025. Meanwhile, the ADR for serviced apartments and other hospitality facilities reached SAR 206, marking a 1.2% YoY decline.
ADR (SAR)
Period
Hotels
Serviced apartments others
Q1 2023
515
205
Q2
756
221
Q3
443
222
Q4
447
218
Q1 2024
494
195
Q2
669
199
Q3
354
200
Q4
440
220
Q1 2025
477
209
Q2
643
201
Q3
341
208
Q4
389
207
Q1 2026
423
206
The table below shows the ADR for hotels and serviced apartments and other hospitality facilities across Saudi regions in Q1 2026:
ADR by region (SAR)
Region
Hotels
Serviced apartments
Tabuk
1,121
155
Riyadh
783
246
Madinah
470
232
Eastern Region
460
205
Qassim
455
164
Hail
438
194
Makkah
367
193
Najran
337
95
Al Baha
288
134
Jazan
286
228
Al Jouf
269
130
Aseer
246
121
Northern Borders
219
139
Meanwhile, the average length of stay (ALOS) at hotels was approximately 4.2 nights in Q1 2026, while guests at serviced apartments and other hospitality facilities stayed an average of 2.2 nights.
ALOS (nights)
Period
Hotels
Serviced apartments and other hospitality facilities
Q1 2023
3.7
2.5
Q2
4.4
2.4
Q3
3.7
2.5
Q4
3.6
2.4
Q1 2024
4.1
2.2
Q2
5.2
2.1
Q3
4.2
2.1
Q4
3.6
2.1
Q1 2025
4.1
2.1
Q2
4.8
2.0
Q3
4.1
2.1
Q4
3.8
2.2
Q1 2026
4.2
2.2
Riyadh city
The hotel room occupancy rate in Saudi Arabia declined to 60.8% in Q1 2026, compared to 63% in the same period of 2025.
Meanwhile, the occupancy rate for serviced apartments and other hospitality facilities inched up to 51.6%, up from 50.7% a year earlier, according to the General Authority for Statistics (GASTAT) Tourism Establishments Statistics Bulletin.
Occupancy Rates for Hotels, Serviced Apartments Others
Period
Hotels (%)
Serviced Apts Others
Q1 2023
63.2%
53.0%
Q2
54.9%
50.9%
Q3
53.4%
56.2%
Q4
60.2%
55.4%
Q1 2024
60.9%
54.5%
Q2
55.4%
52.4%
Q3
46.1%
58.0%
Q4
56.0%
55.9%
Q1 2025
63.0%
50.7%
Q2
53.2%
50.2%
Q3
49.1%
57.4%
Q4
57.3%
55.9%
Q1 2026
60.8%
51.6%
Across regions, hotel and serviced apartment occupancy rates varied significantly. Madinah recorded the highest hotel occupancy rate at 82.5%, followed by Makkah at 59.5% and Riyadh at 50.6%.
Meanwhile, Najran posted the highest occupancy rate for serviced apartments and other hospitality facilities at 60.2%, followed by Riyadh at 59.3% and Madinah at 55.8%.
On the other hand, Al Baha recorded the lowest occupancy rates for both hotels (26.2%) and serviced apartments (27.6%).
Room occupancy rate by region
Region
Hotels
Serviced apartments
Madinah
82.5%
55.8%
Makkah
59.5%
49.6%
Riyadh
50.6%
59.3%
Eastern Region
49.5%
52.0%
Northern Borders
46.5%
37.6%
Qassim
45.9%
53.2%
Jazan
41.0%
47.7%
Al Jouf
39.9%
40.9%
Hail
39.4%
50.7%
Najran
41.5%
60.2%
Tabuk
27.5%
38.5%
Aseer
27.3%
39.3%
Al Baha
26.2%
27.6%
The average daily room rate (ADR) for hotels stood at SAR 423 in Q1 2026, down 11.4% from Q1 2025. Meanwhile, the ADR for serviced apartments and other hospitality facilities reached SAR 206, marking a 1.2% YoY decline.
ADR (SAR)
Period
Hotels
Serviced apartments others
Q1 2023
515
205
Q2
756
221
Q3
443
222
Q4
447
218
Q1 2024
494
195
Q2
669
199
Q3
354
200
Q4
440
220
Q1 2025
477
209
Q2
643
201
Q3
341
208
Q4
389
207
Q1 2026
423
206
The table below shows the ADR for hotels and serviced apartments and other hospitality facilities across Saudi regions in Q1 2026:
ADR by region (SAR)
Region
Hotels
Serviced apartments
Tabuk
1,121
155
Riyadh
783
246
Madinah
470
232
Eastern Region
460
205
Qassim
455
164
Hail
438
194
Makkah
367
193
Najran
337
95
Al Baha
288
134
Jazan
286
228
Al Jouf
269
130
Aseer
246
121
Northern Borders
219
139
Meanwhile, the average length of stay (ALOS) at hotels was approximately 4.2 nights in Q1 2026, while guests at serviced apartments and other hospitality facilities stayed an average of 2.2 nights.
ALOS (nights)
Period
Hotels
Serviced apartments and other hospitality facilities
Q1 2023
3.7
2.5
Q2
4.4
2.4
Q3
3.7
2.5
Q4
3.6
2.4
Q1 2024
4.1
2.2
Q2
5.2
2.1
Q3
4.2
2.1
Q4
3.6
2.1
Q1 2025
4.1
2.1
Q2
4.8
2.0
Q3
4.1
2.1
Q4
3.8
2.2
Q1 2026
4.2
2.2