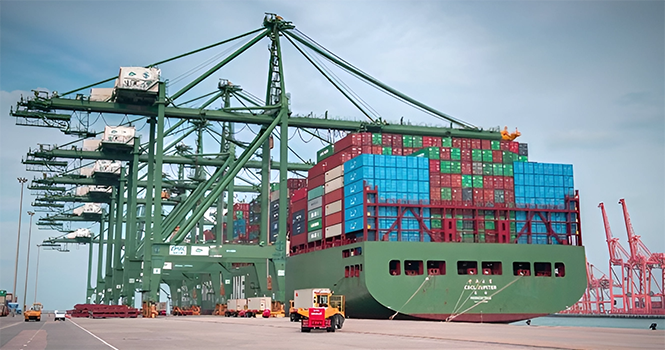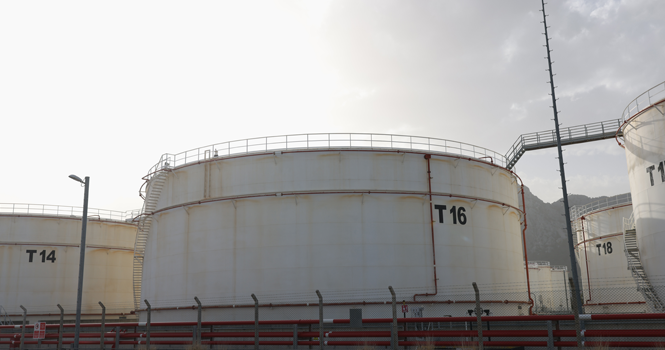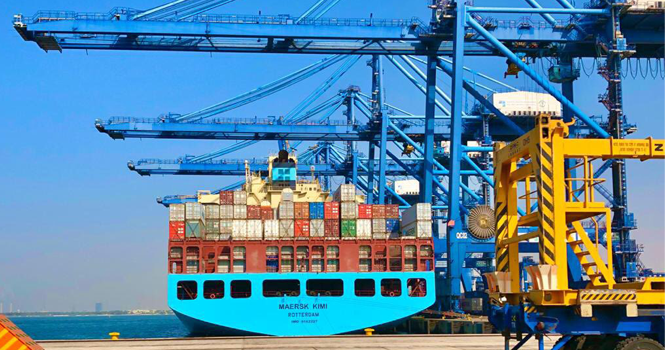
Saudi Arabia’s merchandise imports dropped 25%year-on-year (YoY) to a three-year low at nearly SAR 57.8 billion in March 2026.
This marks the fastest annual pace in more than five years and the strongest performance since July 2020, according to GASTAT.
Compared to February, merchandise imports fell 28%, or nearly SAR 22.3 billion – the biggest monthly decline.
Machinery and mechanical appliances, electrical equipment and their parts thereof topped imports in March, representing 30%or SAR 17.6 billion of the Kingdom’s total imports. Chemical industries followed, making up about 10%.
Vehicles, Aircraft, Vessels, and Associated Transport Equipment dipped 63%to SAR 4.14 billion.
Saudi Imports in November by Segment (SAR bln)
Segment
March 2025
March 2026
Change
(Value)
Change
(%)
Machinery and Mechanical Appliances; Electrical Equipment; Parts Thereof
19.96
17.59
(2.37)
(12%)
Vehicles, Aircraft, Vessels, and Associated Transport Equipment
7.04
5.74
(1.30)
(19%)
Base Metals and Articles of Base Metal
7.45
4.95
(2.50)
(34%)
Products of the Chemical or Allied Industries
3.77
4.76
+0.99
+26%
Precious Stones or Metals and Their Articles, Jewelry
11.05
4.14
(6.91)
(63%)
Minerals
3.45
3.62
+017
+5%
Vegetable Products
3.64
2.54
(1.10)
(30%)
Food Products, Beverages, and Tobacco
3.23
2.48
(0.75)
(23%)
Optical Instruments and Apparatus, and others
2.27
1.79
(0.48)
(21%)
Animal Products
2.42
1.68
(0.74)
(30%)
Others
12.53
8.49
(4.04)
(32%)
Total
76.81
57.78
(19.03)
(25%)
Saudi Arabia’s imports came mainly from China, with SAR 20.7 billion, representing 27%of the total in November 2025. The US came in second with SAR 7.9 billion, followed by the UAE at SAR 4.8 billion.
The top 10 exporters to Saudi Arabia accounted for almost 69%, or SAR 53.1 billion, of total imports in the same month.
Top 10 Exporters to Saudi Arabia in November (SAR bln)
Country
Value
%of Total
China
15.46
26.8%
US
4.88
8.4%
UAE
4.08
7.1%
Switzerland
2.95
5.1%
Egypt
2.65
4.6%
Germany
2.37
4.1%
France
2.08
3.6%
India
2.00
3.5%
Italy
1.93
3.3%
Japan
1.13
2.0%
Other Countries
18.25
31.6%
Total
57.78
100.0%
Saudi Arabia’s merchandise imports dropped 25%year-on-year (YoY) to a three-year low at nearly SAR 57.8 billion in March 2026.
This marks the fastest annual pace in more than five years and the strongest performance since July 2020, according to GASTAT.
Compared to February, merchandise imports fell 28%, or nearly SAR 22.3 billion – the biggest monthly decline.
Machinery and mechanical appliances, electrical equipment and their parts thereof topped imports in March, representing 30%or SAR 17.6 billion of the Kingdom’s total imports. Chemical industries followed, making up about 10%.
Vehicles, Aircraft, Vessels, and Associated Transport Equipment dipped 63%to SAR 4.14 billion.
Saudi Imports in November by Segment (SAR bln)
Segment
March 2025
March 2026
Change
(Value)
Change
(%)
Machinery and Mechanical Appliances; Electrical Equipment; Parts Thereof
19.96
17.59
(2.37)
(12%)
Vehicles, Aircraft, Vessels, and Associated Transport Equipment
7.04
5.74
(1.30)
(19%)
Base Metals and Articles of Base Metal
7.45
4.95
(2.50)
(34%)
Products of the Chemical or Allied Industries
3.77
4.76
+0.99
+26%
Precious Stones or Metals and Their Articles, Jewelry
11.05
4.14
(6.91)
(63%)
Minerals
3.45
3.62
+017
+5%
Vegetable Products
3.64
2.54
(1.10)
(30%)
Food Products, Beverages, and Tobacco
3.23
2.48
(0.75)
(23%)
Optical Instruments and Apparatus, and others
2.27
1.79
(0.48)
(21%)
Animal Products
2.42
1.68
(0.74)
(30%)
Others
12.53
8.49
(4.04)
(32%)
Total
76.81
57.78
(19.03)
(25%)
Saudi Arabia’s imports came mainly from China, with SAR 20.7 billion, representing 27%of the total in November 2025. The US came in second with SAR 7.9 billion, followed by the UAE at SAR 4.8 billion.
The top 10 exporters to Saudi Arabia accounted for almost 69%, or SAR 53.1 billion, of total imports in the same month.
Top 10 Exporters to Saudi Arabia in November (SAR bln)
Country
Value
%of Total
China
15.46
26.8%
US
4.88
8.4%
UAE
4.08
7.1%
Switzerland
2.95
5.1%
Egypt
2.65
4.6%
Germany
2.37
4.1%
France
2.08
3.6%
India
2.00
3.5%
Italy
1.93
3.3%
Japan
1.13
2.0%
Other Countries
18.25
31.6%
Total
57.78
100.0%