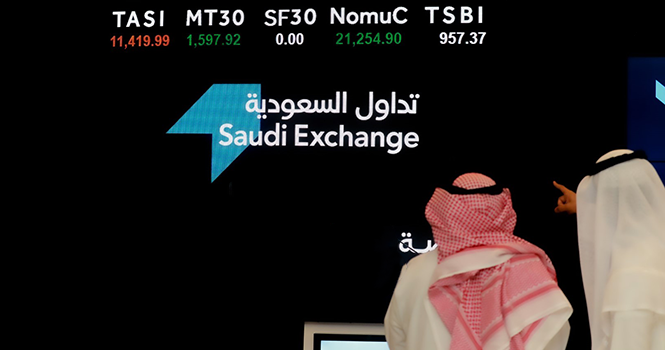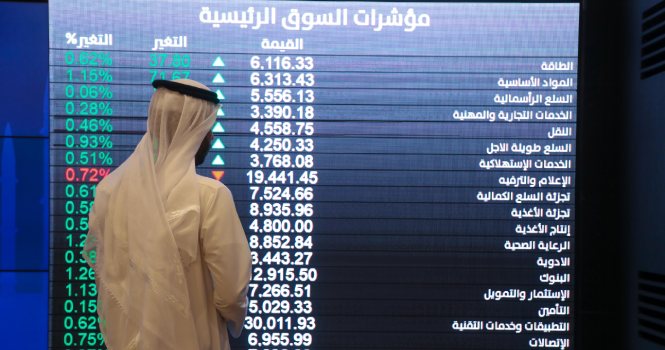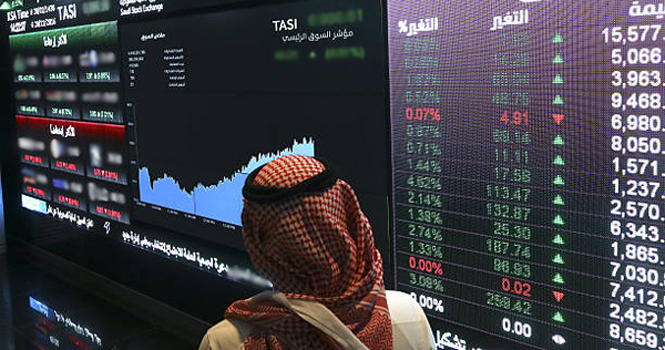
Saudi Arabia’s inflation reached 1.8% in March 2026, compared to the same period last year.
According to data from the General Authority for Statistics (GASTAT), the cost-of-living index (COLI) rose to 104.81 points in March, up from 102.96 points in March 2025.
GASTAT has enhanced the data collection and calculation methodology for the Consumer Price Index (CPI) in line with international best practices to improve coverage and accuracy.
It also updated the index base year to 2023, revising the basket items and their weights while expanding geographic coverage to include all regions.
Inflation is measured as the percentage change in the cost of living compared with the same period a year earlier.
CPI
Period
CPI
YoY Change
January 2024
100.95
1.7%
February
101.01
1.6%
March
100.82
1.2%
April
101.27
1.4%
May
101.34
1.6%
June
101.62
1.8%
July
101.50
1.3%
August
101.55
1.4%
September
101.62
1.5%
October
101.90
1.5%
November
102.25
1.5%
December
102.20
1.4%
January 2025
102.60
1.6%
February
102.72
1.7%
March
102.96
2.1%
April
103.35
2.1%
May
103.46
2.1%
June
103.63
2.0%
July
103.75
2.2%
August
103.89
2.3%
September
103.83
2.2%
October
104.12
2.2%
November
104.20
1.9%
December
104.30
2.1%
January 2026
104.47
1.8%
February
104.50
1.7%
March
104.81
1.8%
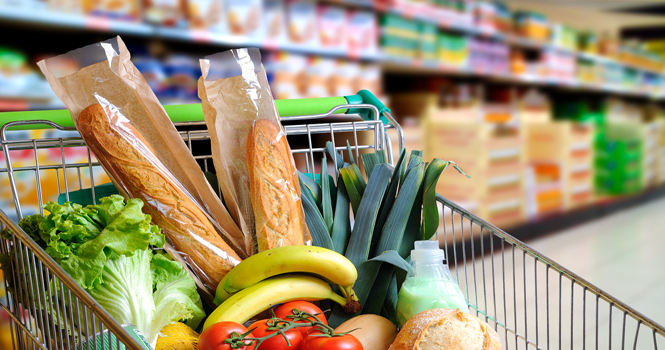
GASTAT attributed the increase mainly to a 3.9% rise in housing, water, electricity, and gas prices, driven by a 4.8% increase in rents, along with higher restaurant and hotel prices (+2.2%) and transport costs (+0.9%).
Main Groups in March 2026
Main Groups
Relative Weight
Change YoY
PersonalGoods, Social Protection Other Goods Services
6.1%
8.2%
Housing, Water, Electricity, Gas Other Fuels
20.2%
3.9%
Restaurants Hotel Services
8.4%
2.2%
Insurance Financial Service
3.2%
2.1%
Recreation, Sports Culture
3.2%
2.0%
Education
2.2%
1.4%
Communications
5.2%
1.0%
Transport
14.5%
0.9%
Tobacco
0.7%
0.4%
Health
4.0%
0.4%
Food Beverages
21.9%
0.3%
Apparel Footwear
3.7%
(0.1%)
Furnishing,Household Equipment Maintenance
6.7%
(0.5%)
All regions across Saudi Arabia recorded higher inflation rates in March compared to February, except Riyadh, Madinah, and Najran.
Riyadh posted the highest inflation rate at 3%, followed by Northern Borders Region at 2.6%, while Eastern Province recorded the lowest rate at 0.4%.
Inflation Rate by City
City
February 2026
March 2026
Riyadh
3.2 %
3.0 %
Northern Borders
2.4 %
2.6 %
Al Jouf
1.8 %
2.3 %
Qassim
1.6 %
2.0 %
Najran
2.1 %
1.8 %
Al Baha
1.7 %
1.7 %
Hail
1.4 %
1.7 %
Makkah
1.5 %
1.6 %
Aseer
1.2 %
1.4 %
Madinah
1.1 %
0.9 %
Jazan
0.6 %
0.9 %
Tabuk
(0.4%)
0.8 %
Eastern Province
0.2 %
0.4 %
Saudi Arabia’s inflation reached 1.8% in March 2026, compared to the same period last year.
According to data from the General Authority for Statistics (GASTAT), the cost-of-living index (COLI) rose to 104.81 points in March, up from 102.96 points in March 2025.
GASTAT has enhanced the data collection and calculation methodology for the Consumer Price Index (CPI) in line with international best practices to improve coverage and accuracy.
It also updated the index base year to 2023, revising the basket items and their weights while expanding geographic coverage to include all regions.
Inflation is measured as the percentage change in the cost of living compared with the same period a year earlier.
CPI
Period
CPI
YoY Change
January 2024
100.95
1.7%
February
101.01
1.6%
March
100.82
1.2%
April
101.27
1.4%
May
101.34
1.6%
June
101.62
1.8%
July
101.50
1.3%
August
101.55
1.4%
September
101.62
1.5%
October
101.90
1.5%
November
102.25
1.5%
December
102.20
1.4%
January 2025
102.60
1.6%
February
102.72
1.7%
March
102.96
2.1%
April
103.35
2.1%
May
103.46
2.1%
June
103.63
2.0%
July
103.75
2.2%
August
103.89
2.3%
September
103.83
2.2%
October
104.12
2.2%
November
104.20
1.9%
December
104.30
2.1%
January 2026
104.47
1.8%
February
104.50
1.7%
March
104.81
1.8%
GASTAT attributed the increase mainly to a 3.9% rise in housing, water, electricity, and gas prices, driven by a 4.8% increase in rents, along with higher restaurant and hotel prices (+2.2%) and transport costs (+0.9%).
Main Groups in March 2026
Main Groups
Relative Weight
Change YoY
PersonalGoods, Social Protection Other Goods Services
6.1%
8.2%
Housing, Water, Electricity, Gas Other Fuels
20.2%
3.9%
Restaurants Hotel Services
8.4%
2.2%
Insurance Financial Service
3.2%
2.1%
Recreation, Sports Culture
3.2%
2.0%
Education
2.2%
1.4%
Communications
5.2%
1.0%
Transport
14.5%
0.9%
Tobacco
0.7%
0.4%
Health
4.0%
0.4%
Food Beverages
21.9%
0.3%
Apparel Footwear
3.7%
(0.1%)
Furnishing,Household Equipment Maintenance
6.7%
(0.5%)
All regions across Saudi Arabia recorded higher inflation rates in March compared to February, except Riyadh, Madinah, and Najran.
Riyadh posted the highest inflation rate at 3%, followed by Northern Borders Region at 2.6%, while Eastern Province recorded the lowest rate at 0.4%.
Inflation Rate by City
City
February 2026
March 2026
Riyadh
3.2 %
3.0 %
Northern Borders
2.4 %
2.6 %
Al Jouf
1.8 %
2.3 %
Qassim
1.6 %
2.0 %
Najran
2.1 %
1.8 %
Al Baha
1.7 %
1.7 %
Hail
1.4 %
1.7 %
Makkah
1.5 %
1.6 %
Aseer
1.2 %
1.4 %
Madinah
1.1 %
0.9 %
Jazan
0.6 %
0.9 %
Tabuk
(0.4%)
0.8 %
Eastern Province
0.2 %
0.4 %