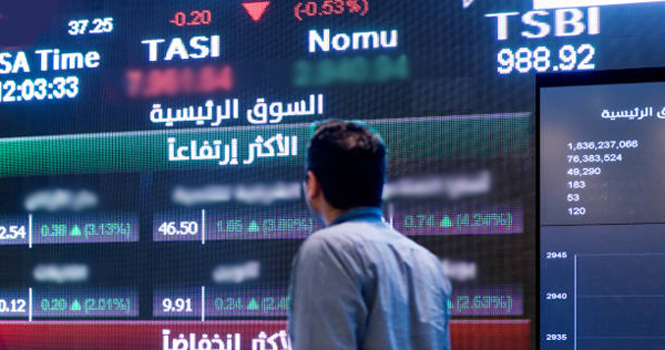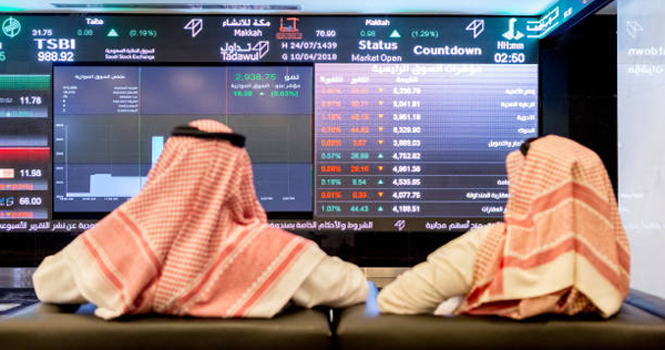
Tadawul trading screen
The market capitalization of the Main Market (TASI) rose 2.7% (or nearly SAR 257.48 billion) week-on-week to about SAR 9.62 trillion in the week ended March 12, according to data issued byTadawul. 
Foreign investors’ ownership accounted for 4.66% of the total market capitalization.
Ownership Value by Nationality Investor Type (SAR bln)
InvestorType
March 5, 2026
March 12, 2026
Change
Saudi Investors
Retail
144.71
147.34
2.62
High-Net-Worth Investors
246.90
248.97
2.07
Individual Professional Investors
437.34
440.77
3.43
Individual DPMs
15.71
15.81
0.10
Total (Retail)
844.67
852.90
8.23
Corporates
1559.70
1601.41
41.72
Mutual Funds
274.24
277.14
2.89
Government Entities
6100.84
6300.82
199.98
Institutional DPMs
67.59
67.69
0.10
Total (Corporate Investors)
8002.37
8247.06
244.69
Total (Saudi Investors)
8847.03
9099.96
252.92
GCC Investors
Individuals
4.68
4.75
0.07
Institutions
65.60
66.64
1.04
DPMs
3.52
3.55
0.03
Total (GCC Investors)
73.81
74.95
1.14
Foreign Investors
SWAP Holders
9.90
9.95
0.05
Foreign Residents
369.89
372.88
2.99
QFIs
2.07
2.12
0.05
DPMs
16.72
16.41
(0.31)
Strategic Investors
46.08
46.72
0.64
Total (Foreign Investors)
444.66
448.08
3.41
Total
9,365.50
9,622.98
257.48
Ownership Ratio by Nationality Investor Type*
InvestorType
March 5, 2026
March 12, 2026
Change
Issued Shares
Free Float
Issued Shares
Free Float
Issued Shares
Free Float
Saudi Investors
Retail
1.55%
4.45%
1.53%
4.45%
(0.01%)
—
High-Net-Worth Investors
2.64%
7.55%
2.59%
7.48%
(0.05%)
(0.07%)
Individual Professional Investors
4.67%
10.64%
4.58%
10.46%
(0.09%)
(0.18%)
Individual DPMs
0.17%
0.48%
0.16%
0.48%
—
(0.01%)
Total (Retail)
9.02%
23.13%
8.86%
22.87%
(0.16%)
(0.26%)
Corporates
16.65%
40.57%
16.64%
40.90%
(0.01%)
0.33%
Mutual Funds
2.93%
7.06%
2.88%
6.98%
(0.05%)
(0.08%)
Government Entities
65.14%
13.04%
65.48%
13.22%
0.34%
0.18%
Institutional DPMs
0.72%
2.01%
0.70%
1.98%
(0.02%)
(0.03%)
Total (Corporate Investors)
85.45%
62.68%
85.70%
63.08%
0.26%
0.40%
Total (Saudi Investors)
94.46%
85.81%
94.56%
85.95%
0.10%
0.14%
GCC Investors
Individuals
0.05%
0.15%
0.05%
0.15%
—
—
Institutions
0.70%
1.26%
0.69%
1.25%
(0.01%)
(0.01%)
DPMs
0.04%
0.11%
0.04%
0.11%
—
—
Total (GCC Investors)
0.79%
1.52%
0.78%
1.51%
(0.01%)
(0.01%)
Foreign Investors
SWAP Holders
0.11%
0.24%
0.10%
0.24%
—
—
Foreign Residents
3.95%
11.83%
3.87%
11.71%
(0.07%)
(0.11%)
QFIs
0.02%
0.07%
0.02%
0.07%
—
—
DPMs
0.18%
0.53%
0.17%
0.52%
(0.01%)
(0.02%)
Strategic Investors
0.49%
—
0.49%
—
(0.01%)
—
Total (Foreign Investors)
4.75%
12.67%
4.66%
12.54%
(0.09%)
(0.13%)
Ownership Value Ratio by Investor Classification (SAR bln)
Investor Classification
Feb. 26, 2026
March 5, 2026
Change in Ownership
Equity
Issued Shares
Free Float
Equity
Issued Shares
Free Float
Institutional
8959.31
95.66%
87.60%
9211.96
95.73%
87.68%
252.66
Non-Institutional
406.20
4.34%
12.40%
411.01
4.27%
12.32%
4.82
Total
9365.50
100%
100%
9622.98
100%
100%
257.48
Tadawul trading screen
The market capitalization of the Main Market (TASI) rose 2.7% (or nearly SAR 257.48 billion) week-on-week to about SAR 9.62 trillion in the week ended March 12, according to data issued byTadawul.
Foreign investors’ ownership accounted for 4.66% of the total market capitalization.
Ownership Value by Nationality Investor Type (SAR bln)
InvestorType
March 5, 2026
March 12, 2026
Change
Saudi Investors
Retail
144.71
147.34
2.62
High-Net-Worth Investors
246.90
248.97
2.07
Individual Professional Investors
437.34
440.77
3.43
Individual DPMs
15.71
15.81
0.10
Total (Retail)
844.67
852.90
8.23
Corporates
1559.70
1601.41
41.72
Mutual Funds
274.24
277.14
2.89
Government Entities
6100.84
6300.82
199.98
Institutional DPMs
67.59
67.69
0.10
Total (Corporate Investors)
8002.37
8247.06
244.69
Total (Saudi Investors)
8847.03
9099.96
252.92
GCC Investors
Individuals
4.68
4.75
0.07
Institutions
65.60
66.64
1.04
DPMs
3.52
3.55
0.03
Total (GCC Investors)
73.81
74.95
1.14
Foreign Investors
SWAP Holders
9.90
9.95
0.05
Foreign Residents
369.89
372.88
2.99
QFIs
2.07
2.12
0.05
DPMs
16.72
16.41
(0.31)
Strategic Investors
46.08
46.72
0.64
Total (Foreign Investors)
444.66
448.08
3.41
Total
9,365.50
9,622.98
257.48
Ownership Ratio by Nationality Investor Type*
InvestorType
March 5, 2026
March 12, 2026
Change
Issued Shares
Free Float
Issued Shares
Free Float
Issued Shares
Free Float
Saudi Investors
Retail
1.55%
4.45%
1.53%
4.45%
(0.01%)
—
High-Net-Worth Investors
2.64%
7.55%
2.59%
7.48%
(0.05%)
(0.07%)
Individual Professional Investors
4.67%
10.64%
4.58%
10.46%
(0.09%)
(0.18%)
Individual DPMs
0.17%
0.48%
0.16%
0.48%
—
(0.01%)
Total (Retail)
9.02%
23.13%
8.86%
22.87%
(0.16%)
(0.26%)
Corporates
16.65%
40.57%
16.64%
40.90%
(0.01%)
0.33%
Mutual Funds
2.93%
7.06%
2.88%
6.98%
(0.05%)
(0.08%)
Government Entities
65.14%
13.04%
65.48%
13.22%
0.34%
0.18%
Institutional DPMs
0.72%
2.01%
0.70%
1.98%
(0.02%)
(0.03%)
Total (Corporate Investors)
85.45%
62.68%
85.70%
63.08%
0.26%
0.40%
Total (Saudi Investors)
94.46%
85.81%
94.56%
85.95%
0.10%
0.14%
GCC Investors
Individuals
0.05%
0.15%
0.05%
0.15%
—
—
Institutions
0.70%
1.26%
0.69%
1.25%
(0.01%)
(0.01%)
DPMs
0.04%
0.11%
0.04%
0.11%
—
—
Total (GCC Investors)
0.79%
1.52%
0.78%
1.51%
(0.01%)
(0.01%)
Foreign Investors
SWAP Holders
0.11%
0.24%
0.10%
0.24%
—
—
Foreign Residents
3.95%
11.83%
3.87%
11.71%
(0.07%)
(0.11%)
QFIs
0.02%
0.07%
0.02%
0.07%
—
—
DPMs
0.18%
0.53%
0.17%
0.52%
(0.01%)
(0.02%)
Strategic Investors
0.49%
—
0.49%
—
(0.01%)
—
Total (Foreign Investors)
4.75%
12.67%
4.66%
12.54%
(0.09%)
(0.13%)
Ownership Value Ratio by Investor Classification (SAR bln)
Investor Classification
Feb. 26, 2026
March 5, 2026
Change in Ownership
Equity
Issued Shares
Free Float
Equity
Issued Shares
Free Float
Institutional
8959.31
95.66%
87.60%
9211.96
95.73%
87.68%
252.66
Non-Institutional
406.20
4.34%
12.40%
411.01
4.27%
12.32%
4.82
Total
9365.50
100%
100%
9622.98
100%
100%
257.48