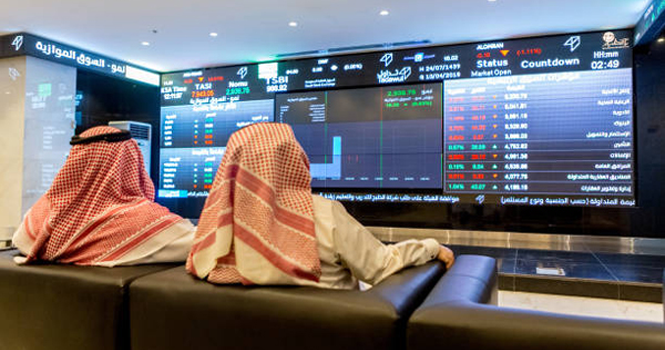
Tadawul trading screen
The market capitalization of the Saudi Exchange (Tadawul) fell 0.9%, or SAR 75.3 billion, week-on- week to about SAR 8.77 trillion in the week ended Jan. 8, according to data issued by Tadawul. 
Foreign investors’ ownership accounted for 4.78% of the total market capital.
Ownership Value by Nationality Investor Type (SAR bln)
Investor Type
Jan. 1, 2026
Jan. 8, 2026
Change
Saudi Investors
Retail
143.91
143.61
(0.30)
High-Net-Worth Investors
244.94
243.43
(1.51)
Individual Professional Investors
435.28
432.17
(3.11)
Individual DPMs
16.36
16.22
(0.14)
Total (Retail)
840.49
835.43
(5.06)
Corporates
1501.19
1478.62
(22.56)
Mutual Funds
274.47
272.94
(1.54)
Government Entities
5670.31
5625.32
(44.99)
Institutional DPMs
67.62
67.49
(0.13)
Total (Corporate Investors)
7513.59
7444.38
(69.22)
Total (Saudi Investors)
8354.08
8279.81
(74.27)
GCC Investors
Individuals
4.59
4.60
0.01
Institutions
66.42
64.36
(2.06)
DPMs
3.49
3.50
0.01
Total (GCC Investors)
74.50
72.47
(2.03)
Foreign Investors
SWAP Holders
1.04
2.15
1.11
Foreign Residents
18.13
18.37
0.24
QFIs
339.43
340.13
0.70
DPMs
13.85
13.43
(0.42)
Strategic Partners
45.79
45.14
(0.65)
Total (Foreign Investors)
418.25
419.21
0.96
Total
8846.83
8771.49
(75.34)
*Excluding corporate procedures
Ownership Ratio by Nationality Investor Type*
Investor Type
Jan. 1, 2026
Jan. 8, 2026
Change
Issued Shaes
Free Float
Issued Shares
Free Float
Issued Shares
Free Float
Saudi Investors
Retail
1.63%
4.58%
1.64%
4.61%
0.01%
0.03%
High-Net-Worth Investors
2.77%
7.74%
2.78%
7.76%
0.01%
0.03%
Individual Professional Investors
4.92%
10.84%
4.93%
10.91%
0.01%
0.07%
Individual DPMs
0.18%
0.52%
0.18%
0.52%
—
—
Total (Retail)
9.50%
23.67%
9.52%
23.81%
0.02%
0.13%
Corporates
16.97%
40.25%
16.86%
40.02%
(0.11%)
(0.23%)
Mutual Funds
3.10%
7.28%
3.11%
7.33%
0.01%
0.05%
Government Entities
64.09%
12.75%
64.13%
12.74%
0.04%
(0.01%)
Institutional DPMs
0.76%
2.07%
0.77%
2.09%
0.01%
0.02%
Total (Corporate Investors)
84.93%
62.36%
84.87%
62.18%
(0.06%)
(0.18%)
Total (Saudi Investors)
94.43%
86.03%
94.39%
85.98%
(0.04%)
(0.05%)
GCC Investors
Individuals
0.05%
0.15%
0.05%
0.15%
—
—
Institutions
0.75%
1.29%
0.73%
1.26%
(0.02%)
(0.03%)
DPMs
0.04%
0.12%
0.04%
0.12%
—
—
Total (GCC Investors)
0.84%
1.56%
0.83%
1.53%
(0.02%)
(0.03%)
Foreign Investors
SWAP Holders
0.01%
0.03%
0.02%
0.07%
0.01%
0.04%
Foreign Residents
0.20%
0.60%
0.21%
0.61%
—
0.01%
QFIs
3.84%
11.31%
3.88%
11.36%
0.04%
0.05%
DPMs
0.16%
0.46%
0.15%
0.45%
(0.01%)
(0.01%)
Strategic Partners
0.52%
—
0.51%
—
(0.01%)
—
Total (Foreign Investors)
4.73%
12.41%
4.78%
12.49%
0.05%
0.08%
*Excluding corporate procedures
Ownership’s Value Ratio by Investor Classification (SAR bln)
Investor Classification
Jan. 1, 2026
Jan. 8, 2026
Change in Ownership
Equity
Issued Shares
Free Float
Equity
Issued Shares
Free Float
Institutional
8435.26
95.35%
86.94%
8361.47
95.33%
86.87%
(73.79)
Non-Institutional
411.58
4.65%
13.06%
410.02
4.67%
13.13%
(1.56)
Total
8846.83
100%
100%
8771.49
100%
100%
(75.34)
Tadawul trading screen
The market capitalization of the Saudi Exchange (Tadawul) fell 0.9%, or SAR 75.3 billion, week-on- week to about SAR 8.77 trillion in the week ended Jan. 8, according to data issued by Tadawul.
Foreign investors’ ownership accounted for 4.78% of the total market capital.
Ownership Value by Nationality Investor Type (SAR bln)
Investor Type
Jan. 1, 2026
Jan. 8, 2026
Change
Saudi Investors
Retail
143.91
143.61
(0.30)
High-Net-Worth Investors
244.94
243.43
(1.51)
Individual Professional Investors
435.28
432.17
(3.11)
Individual DPMs
16.36
16.22
(0.14)
Total (Retail)
840.49
835.43
(5.06)
Corporates
1501.19
1478.62
(22.56)
Mutual Funds
274.47
272.94
(1.54)
Government Entities
5670.31
5625.32
(44.99)
Institutional DPMs
67.62
67.49
(0.13)
Total (Corporate Investors)
7513.59
7444.38
(69.22)
Total (Saudi Investors)
8354.08
8279.81
(74.27)
GCC Investors
Individuals
4.59
4.60
0.01
Institutions
66.42
64.36
(2.06)
DPMs
3.49
3.50
0.01
Total (GCC Investors)
74.50
72.47
(2.03)
Foreign Investors
SWAP Holders
1.04
2.15
1.11
Foreign Residents
18.13
18.37
0.24
QFIs
339.43
340.13
0.70
DPMs
13.85
13.43
(0.42)
Strategic Partners
45.79
45.14
(0.65)
Total (Foreign Investors)
418.25
419.21
0.96
Total
8846.83
8771.49
(75.34)
*Excluding corporate procedures
Ownership Ratio by Nationality Investor Type*
Investor Type
Jan. 1, 2026
Jan. 8, 2026
Change
Issued Shaes
Free Float
Issued Shares
Free Float
Issued Shares
Free Float
Saudi Investors
Retail
1.63%
4.58%
1.64%
4.61%
0.01%
0.03%
High-Net-Worth Investors
2.77%
7.74%
2.78%
7.76%
0.01%
0.03%
Individual Professional Investors
4.92%
10.84%
4.93%
10.91%
0.01%
0.07%
Individual DPMs
0.18%
0.52%
0.18%
0.52%
—
—
Total (Retail)
9.50%
23.67%
9.52%
23.81%
0.02%
0.13%
Corporates
16.97%
40.25%
16.86%
40.02%
(0.11%)
(0.23%)
Mutual Funds
3.10%
7.28%
3.11%
7.33%
0.01%
0.05%
Government Entities
64.09%
12.75%
64.13%
12.74%
0.04%
(0.01%)
Institutional DPMs
0.76%
2.07%
0.77%
2.09%
0.01%
0.02%
Total (Corporate Investors)
84.93%
62.36%
84.87%
62.18%
(0.06%)
(0.18%)
Total (Saudi Investors)
94.43%
86.03%
94.39%
85.98%
(0.04%)
(0.05%)
GCC Investors
Individuals
0.05%
0.15%
0.05%
0.15%
—
—
Institutions
0.75%
1.29%
0.73%
1.26%
(0.02%)
(0.03%)
DPMs
0.04%
0.12%
0.04%
0.12%
—
—
Total (GCC Investors)
0.84%
1.56%
0.83%
1.53%
(0.02%)
(0.03%)
Foreign Investors
SWAP Holders
0.01%
0.03%
0.02%
0.07%
0.01%
0.04%
Foreign Residents
0.20%
0.60%
0.21%
0.61%
—
0.01%
QFIs
3.84%
11.31%
3.88%
11.36%
0.04%
0.05%
DPMs
0.16%
0.46%
0.15%
0.45%
(0.01%)
(0.01%)
Strategic Partners
0.52%
—
0.51%
—
(0.01%)
—
Total (Foreign Investors)
4.73%
12.41%
4.78%
12.49%
0.05%
0.08%
*Excluding corporate procedures
Ownership’s Value Ratio by Investor Classification (SAR bln)
Investor Classification
Jan. 1, 2026
Jan. 8, 2026
Change in Ownership
Equity
Issued Shares
Free Float
Equity
Issued Shares
Free Float
Institutional
8435.26
95.35%
86.94%
8361.47
95.33%
86.87%
(73.79)
Non-Institutional
411.58
4.65%
13.06%
410.02
4.67%
13.13%
(1.56)
Total
8846.83
100%
100%
8771.49
100%
100%
(75.34)