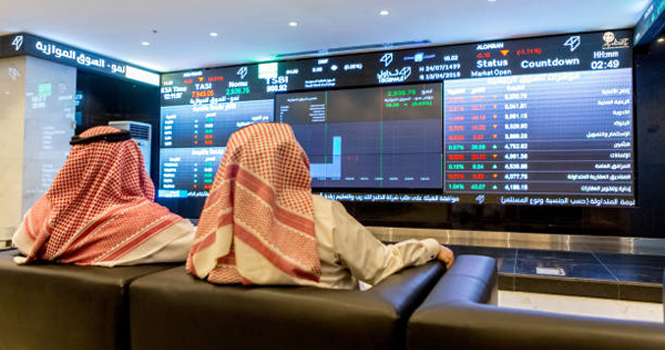
Nomutrading screen
The market capitalization of the Saudi Exchange (Tadawul) fell 0.72%, or about SAR 68.33 billion, week-on-week (WoW) to about SAR 9.413 trillion in the week ended Nov. 20, according to data issued by Tadawul. 
Foreign investors’ ownership accounted for 4.57% of the total market capital.
Ownership Value by Nationality Investor Type (SAR bln)
Investor Type
Nov. 13, 2025
Nov. 20, 2025
Change
Saudi Investors
Retail
153.46
151.75
(1.70)
High-Net-Worth Investors
255.83
251.87
(3.96)
Individual Professional Investors
454.74
447.53
(7.21)
Individual DPMs
17.20
16.81
(0.39)
Total (Retail)
881.22
867.96
(13.26)
Corporates
1619.88
1600.67
(19.21)
Mutual Funds
287.88
282.34
(5.53)
Government Entities
6110.50
6087.73
(22.77)
Institutional DPMs
73.64
71.54
(2.10)
Total (Corporate Investors)
8091.89
8042.28
(49.62)
Total (Saudi Investors)
8973.11
8910.24
(62.87)
GCC Investors
Individuals
5.05
5.05
—
Institutions
65.55
64.39
(1.16)
DPMs
3.69
3.60
(0.09)
Total (GCC Investors)
74.29
73.04
(1.25)
Foreign Investors
SWAP Holders
2.20
2.19
(0.01)
Foreign Residents
18.67
18.73
0.06
QFIs
351.89
348.48
(3.41)
DPMs
15.29
14.80
(0.48)
Strategic Partners
46.03
45.67
(0.36)
Total (Foreign Investors)
434.08
429.87
(4.21)
9481.48
9413.15
(68.33)
Ownership Ratio by Nationality Investor Type*
Investor Type
Nov. 13, 2025
Nov. 20, 2025
Change
Issued Shares
Free Float
Issued Shares
Free Float
Issued Shares
Free Float
Saudi Investors
Retail
1.62%
4.59%
1.61%
4.60%
(0.01%)
0.01%
High-Net-Worth Investors
2.70%
7.61%
2.68%
7.57%
(0.02%)
(0.03%)
Individual Professional Investors
4.80%
10.65%
4.75%
10.63%
(0.04%)
(0.01%)
Individual DPMs
0.18%
0.51%
0.18%
0.51%
—
(0.01%)
Total (Retail)
9.29%
23.36%
9.22%
23.31%
(0.07%)
(0.04%)
Corporates
17.08%
40.82%
17.00%
40.84%
(0.08%)
0.02%
Mutual Funds
3.04%
7.23%
3.00%
7.18%
(0.04%)
(0.05%)
Government Entities
64.45%
12.89%
64.67%
12.96%
0.23%
0.07%
Institutional DPMs
0.78%
2.11%
0.76%
2.09%
(0.02%)
(0.02%)
Total (Corporate Investors)
85.34%
63.05%
85.44%
63.07%
0.09%
0.02%
Total (Saudi Investors)
94.64%
86.40%
94.66%
86.38%
0.02%
(0.02%)
GCC Investors
Individuals
0.05%
0.16%
0.05%
0.16%
—
—
Institutions
0.69%
1.17%
0.68%
1.17%
(0.01%)
—
DPMs
0.04%
0.12%
0.04%
0.11%
—
—
Total (GCC Investors)
0.78%
1.45%
0.78%
1.45%
(0.01%)
—
Foreign Investors
SWAP Holders
0.02%
0.07%
0.02%
0.07%
—
—
Foreign Residents
0.20%
0.58%
0.20%
0.59%
—
0.01%
QFIs
3.71%
11.02%
3.70%
11.05%
(0.01%)
0.02%
DPMs
0.16%
0.48%
0.16%
0.47%
—
(0.01%)
Strategic Partners
0.49%
—
0.49%
—
—
—
Total (Foreign Investors)
4.58%
12.15%
4.57%
12.17%
(0.01%)
0.02%
Ownership’s Value Ratio by Investor Classification (SAR bln)
Investor Classification
Nov. 13, 2025
Nov. 20, 2025
Change in Ownership
Equity
Issued Shares
Free Float
Equity
Issued Shares
Free Float
Institutional
9048.47
95.43%
87.07%
8985.74
95.46%
87.08%
(62.73)
Non-Institutional
433.01
4.57%
12.93%
427.41
4.54%
12.92%
(5.60)
Total
9481.48
100%
100%
9413.15
100%
100%
(68.33)
Nomutrading screen
The market capitalization of the Saudi Exchange (Tadawul) fell 0.72%, or about SAR 68.33 billion, week-on-week (WoW) to about SAR 9.413 trillion in the week ended Nov. 20, according to data issued by Tadawul.
Foreign investors’ ownership accounted for 4.57% of the total market capital.
Ownership Value by Nationality Investor Type (SAR bln)
Investor Type
Nov. 13, 2025
Nov. 20, 2025
Change
Saudi Investors
Retail
153.46
151.75
(1.70)
High-Net-Worth Investors
255.83
251.87
(3.96)
Individual Professional Investors
454.74
447.53
(7.21)
Individual DPMs
17.20
16.81
(0.39)
Total (Retail)
881.22
867.96
(13.26)
Corporates
1619.88
1600.67
(19.21)
Mutual Funds
287.88
282.34
(5.53)
Government Entities
6110.50
6087.73
(22.77)
Institutional DPMs
73.64
71.54
(2.10)
Total (Corporate Investors)
8091.89
8042.28
(49.62)
Total (Saudi Investors)
8973.11
8910.24
(62.87)
GCC Investors
Individuals
5.05
5.05
—
Institutions
65.55
64.39
(1.16)
DPMs
3.69
3.60
(0.09)
Total (GCC Investors)
74.29
73.04
(1.25)
Foreign Investors
SWAP Holders
2.20
2.19
(0.01)
Foreign Residents
18.67
18.73
0.06
QFIs
351.89
348.48
(3.41)
DPMs
15.29
14.80
(0.48)
Strategic Partners
46.03
45.67
(0.36)
Total (Foreign Investors)
434.08
429.87
(4.21)
9481.48
9413.15
(68.33)
Ownership Ratio by Nationality Investor Type*
Investor Type
Nov. 13, 2025
Nov. 20, 2025
Change
Issued Shares
Free Float
Issued Shares
Free Float
Issued Shares
Free Float
Saudi Investors
Retail
1.62%
4.59%
1.61%
4.60%
(0.01%)
0.01%
High-Net-Worth Investors
2.70%
7.61%
2.68%
7.57%
(0.02%)
(0.03%)
Individual Professional Investors
4.80%
10.65%
4.75%
10.63%
(0.04%)
(0.01%)
Individual DPMs
0.18%
0.51%
0.18%
0.51%
—
(0.01%)
Total (Retail)
9.29%
23.36%
9.22%
23.31%
(0.07%)
(0.04%)
Corporates
17.08%
40.82%
17.00%
40.84%
(0.08%)
0.02%
Mutual Funds
3.04%
7.23%
3.00%
7.18%
(0.04%)
(0.05%)
Government Entities
64.45%
12.89%
64.67%
12.96%
0.23%
0.07%
Institutional DPMs
0.78%
2.11%
0.76%
2.09%
(0.02%)
(0.02%)
Total (Corporate Investors)
85.34%
63.05%
85.44%
63.07%
0.09%
0.02%
Total (Saudi Investors)
94.64%
86.40%
94.66%
86.38%
0.02%
(0.02%)
GCC Investors
Individuals
0.05%
0.16%
0.05%
0.16%
—
—
Institutions
0.69%
1.17%
0.68%
1.17%
(0.01%)
—
DPMs
0.04%
0.12%
0.04%
0.11%
—
—
Total (GCC Investors)
0.78%
1.45%
0.78%
1.45%
(0.01%)
—
Foreign Investors
SWAP Holders
0.02%
0.07%
0.02%
0.07%
—
—
Foreign Residents
0.20%
0.58%
0.20%
0.59%
—
0.01%
QFIs
3.71%
11.02%
3.70%
11.05%
(0.01%)
0.02%
DPMs
0.16%
0.48%
0.16%
0.47%
—
(0.01%)
Strategic Partners
0.49%
—
0.49%
—
—
—
Total (Foreign Investors)
4.58%
12.15%
4.57%
12.17%
(0.01%)
0.02%
Ownership’s Value Ratio by Investor Classification (SAR bln)
Investor Classification
Nov. 13, 2025
Nov. 20, 2025
Change in Ownership
Equity
Issued Shares
Free Float
Equity
Issued Shares
Free Float
Institutional
9048.47
95.43%
87.07%
8985.74
95.46%
87.08%
(62.73)
Non-Institutional
433.01
4.57%
12.93%
427.41
4.54%
12.92%
(5.60)
Total
9481.48
100%
100%
9413.15
100%
100%
(68.33)