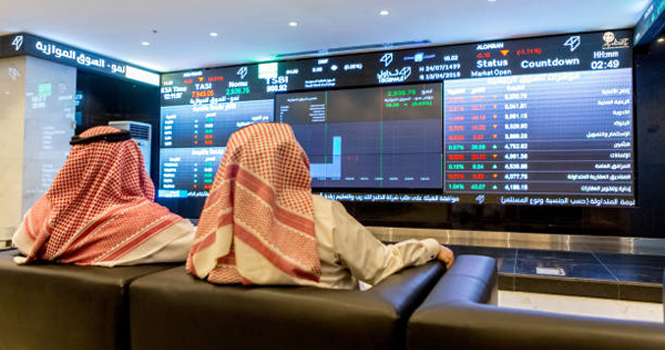
US stock trading screen
Saudi trading in US stocks, executed through local financial institutions, hit an all-time high of SAR 216.1 billion in Q3 2025, marking a 141% surge (SAR 126.4 billion) versus the year-ago period.
Saudi trading in the US stock market during Q3 2025 was the highest on record, according to data issued by the Capital Market Authority (CMA).
Trading jumped by 12%, or SAR 22.7 billion, in Q3 2025, compared to SAR 193.4 billion in Q2 2025.
The CMA report on the trading value of local authorized brokers in the global markets does not include either details on the number of Saudi portfolios abroad, the number of investors trading directly through foreign brokers, or their trading volumes.
Saudi Transactions on US Equities
Period
Value (SAR bln)
Change YoY
Q1 2022
85.90
+10%
Q2 2022
147.44
+143%
Q3 2022
99.50
+96%
Q4 2022
50.35
+9%
Q1 2023
58.84
(31%)
Q2 2023
59.81
(59%)
Q3 2023
42.59
(57%)
Q4 2023
58.73
+17%
Q1 2024
62.31
+6%
Q2 2024
58.56
(2%)
Q3 2024
89.66
+111%
Q4 2024
102.18
+74%
Q1 2025*
173.78
+179%
Q2 2025
193.40
+230%
Q3 2025
216.08
+141%
The Saudi transactions in the US market accounted for nearly 98.8% of total trading by Saudis in foreign markets during Q3 2025, which reached SAR 218.8 billion.
Traded Value by Authorized Market Institutions in Foreign Markets (SAR mln)
Region
Value (SAR mln)
Percentage (%)
US
216083
98.8%
European
1628
0.7%
GCC
685
0.3%
Asian
160
0.1%
Arabian
67
0.03%
Others
139
0.1%
Total
218762
100%
Elsewhere, Saudi investors’ trades in GCC markets fell 16% YoY to SAR 685 million during the same quarter.
Saudi Trades on GCC Equities
Period
Value (SAR bln)
Change YoY
Q1 2022
1822
+102%
Q2 2022
1337
(32%)
Q3 2022
789
+29%
Q4 2022
1204
(34%)
Q1 2023
1118
(39%)
Q2 2023
963
(28%)
Q3 2023
1189
+51%
Q4 2023
753
(37%)
Q1 2024
855
(24%)
Q2 2024
1169
+21%
Q3 2024
813
(32%)
Q4 2024
1049
+39%
Q1 2025
1430
+67%
Q2 2025
2196
+88%
Q3 2025
685
(16%)