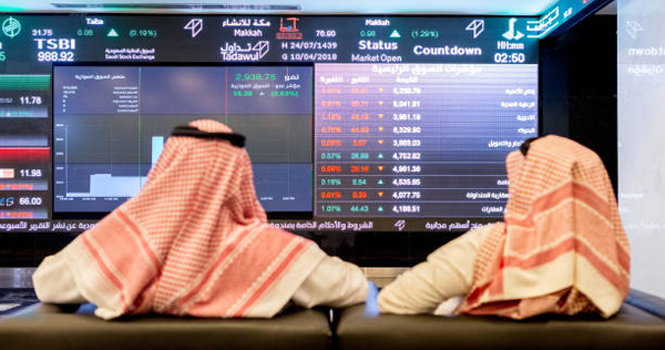
Tadawul trading screen
The market capitalization of the Saudi Exchange (Tadawul) rose by SAR 349.77 billion (3.75%) month-on-month (MoM) to about SAR 9.66 trillion in October, according to data issued by Tadawul. 
Foreign investors’ ownership accounted for 4.68% of the total market cap as of Oct. 30, 2025.
Ownership Value by Nationality Investor Type (SAR bln)
Investor Type
Sept. 30, 2025
Oct. 30, 2025
Change
Saudi Investors
Retail
158.75
158.29
(0.45)
High-Net-Worth Investors
0268.3
267.77
(0.54)
Individual Professional Investors
0475.2
476.60
1.40
Individual DPMs
17.08
17.85
0.77
Total (Retail)
919.34
920.51
1.17
Corporates
1621.49
1671.50
50.00
Mutual Funds
298.85
304.72
5.87
Government Entities
5881.63
6164.86
283.23
Institutional DPMs
77.72
77.39
(0.33)
Total (Corporate Investors)
7879.69
8218.46
338.76
Total (Saudi Investors)
8799.03
9138.97
339.94
GCC Investors
Individuals
4.97
5.10
0.12
Institutions
65.72
67.39
1.68
DPMs
3.97
3.87
(0.10)
Total (GCC Investors)
74.66
76.36
1.70
Foreign Investors
SWAP Holders
2.27
2.34
0.07
Foreign Residents
19.46
19.55
0.09
QFIs
357.57
366.64
9.06
DPMs
14.95
15.95
1.00
Strategic Partners
50.19
48.09
(2.10)
Total (Foreign Investors)
444.44
452.57
8.13
Total
9318.13
9667.90
349.77
Ownership Ratio by Nationality Investor Type*
Investor Type
Sept. 30, 2025
Oct. 30, 2025
Change
Issued Shares
Free Float
Issued Shares
Free Float
Issued Shares
Free Float
Saudi Investors
Retail
1.70%
4.70%
1.64%
4.58%
(0.07%)
(0.12%)
High-Net-Worth Investors
2.88%
7.90%
2.77%
7.70%
(0.11%)
(0.20%)
Individual Professional Investors
5.10%
11.07%
4.93%
10.84%
(0.17%)
(0.23%)
Individual DPMs
0.18%
0.50%
0.18%
0.51%
—
0.01%
Total (Retail)
9.87%
24.17%
9.52%
23.64%
(0.34%)
(0.53%)
Corporates
17.40%
39.99%
17.29%
40.46%
(0.11%)
0.47%
Mutual Funds
3.21%
7.41%
3.15%
7.33%
(0.06%)
(0.07%)
Government Entities
63.12%
12.59%
63.77%
12.73%
0.65%
0.14%
Institutional DPMs
0.83%
2.19%
0.80%
2.14%
(0.03%)
(0.05%)
Total (Corporate Investors)
84.56%
62.18%
85.01%
62.66%
0.44%
0.49%
Total (Saudi Investors)
94.43%
86.35%
94.53%
86.30%
0.10%
(0.05%)
GCC Investors
Individuals
0.05%
0.15%
0.05%
0.15%
—
—
Institutions
0.71%
1.15%
0.70%
1.17%
(0.01%)
0.01%
DPMs
0.04%
0.12%
0.04%
0.12%
—
(0.01%)
Total (GCC Investors)
0.80%
1.43%
0.97%
1.44%
(0.01%)
0.01%
Foreign Investors
SWAP Holders
0.02%
0.07%
0.02%
0.07%
—
—
Foreign Residents
0.21%
0.60%
0.20%
0.59%
(0.01%)
(0.01%)
QFIs
3.84%
11.09%
3.79%
11.12%
(0.05%)
0.03%
DPMs
0.16%
0.46%
0.16%
0.48%
—
0.02%
Strategic Partners
0.54%
—
0.50%
—
(0.04%)
—
Total (Foreign Investors)
4.77%
12.22%
4.68%
12.26%
(0.09%)
0.04%
Ownership’s Value Ratio by Investor Classification (SAR bln)
Investor Classification
Sept. 30, 2025
Oct. 30, 2025
Change in Ownership
Equity
Issued Shares
Free Float
Equity
Issued Shares
Free Float
Institutional
8866.65
95.15%
86.65%
9217.19
95.34%
86.98%
350.54
Non-Institutional
451.48
4.85%
13.35%
450.71
4.66%
13.02%
(0.77)
Total
9318.13
100%
100%
9667.90
100%
100%
349.77
Tadawul trading screen
The market capitalization of the Saudi Exchange (Tadawul) rose by SAR 349.77 billion (3.75%) month-on-month (MoM) to about SAR 9.66 trillion in October, according to data issued by Tadawul.
Foreign investors’ ownership accounted for 4.68% of the total market cap as of Oct. 30, 2025.
Ownership Value by Nationality Investor Type (SAR bln)
Investor Type
Sept. 30, 2025
Oct. 30, 2025
Change
Saudi Investors
Retail
158.75
158.29
(0.45)
High-Net-Worth Investors
0268.3
267.77
(0.54)
Individual Professional Investors
0475.2
476.60
1.40
Individual DPMs
17.08
17.85
0.77
Total (Retail)
919.34
920.51
1.17
Corporates
1621.49
1671.50
50.00
Mutual Funds
298.85
304.72
5.87
Government Entities
5881.63
6164.86
283.23
Institutional DPMs
77.72
77.39
(0.33)
Total (Corporate Investors)
7879.69
8218.46
338.76
Total (Saudi Investors)
8799.03
9138.97
339.94
GCC Investors
Individuals
4.97
5.10
0.12
Institutions
65.72
67.39
1.68
DPMs
3.97
3.87
(0.10)
Total (GCC Investors)
74.66
76.36
1.70
Foreign Investors
SWAP Holders
2.27
2.34
0.07
Foreign Residents
19.46
19.55
0.09
QFIs
357.57
366.64
9.06
DPMs
14.95
15.95
1.00
Strategic Partners
50.19
48.09
(2.10)
Total (Foreign Investors)
444.44
452.57
8.13
Total
9318.13
9667.90
349.77
Ownership Ratio by Nationality Investor Type*
Investor Type
Sept. 30, 2025
Oct. 30, 2025
Change
Issued Shares
Free Float
Issued Shares
Free Float
Issued Shares
Free Float
Saudi Investors
Retail
1.70%
4.70%
1.64%
4.58%
(0.07%)
(0.12%)
High-Net-Worth Investors
2.88%
7.90%
2.77%
7.70%
(0.11%)
(0.20%)
Individual Professional Investors
5.10%
11.07%
4.93%
10.84%
(0.17%)
(0.23%)
Individual DPMs
0.18%
0.50%
0.18%
0.51%
—
0.01%
Total (Retail)
9.87%
24.17%
9.52%
23.64%
(0.34%)
(0.53%)
Corporates
17.40%
39.99%
17.29%
40.46%
(0.11%)
0.47%
Mutual Funds
3.21%
7.41%
3.15%
7.33%
(0.06%)
(0.07%)
Government Entities
63.12%
12.59%
63.77%
12.73%
0.65%
0.14%
Institutional DPMs
0.83%
2.19%
0.80%
2.14%
(0.03%)
(0.05%)
Total (Corporate Investors)
84.56%
62.18%
85.01%
62.66%
0.44%
0.49%
Total (Saudi Investors)
94.43%
86.35%
94.53%
86.30%
0.10%
(0.05%)
GCC Investors
Individuals
0.05%
0.15%
0.05%
0.15%
—
—
Institutions
0.71%
1.15%
0.70%
1.17%
(0.01%)
0.01%
DPMs
0.04%
0.12%
0.04%
0.12%
—
(0.01%)
Total (GCC Investors)
0.80%
1.43%
0.97%
1.44%
(0.01%)
0.01%
Foreign Investors
SWAP Holders
0.02%
0.07%
0.02%
0.07%
—
—
Foreign Residents
0.21%
0.60%
0.20%
0.59%
(0.01%)
(0.01%)
QFIs
3.84%
11.09%
3.79%
11.12%
(0.05%)
0.03%
DPMs
0.16%
0.46%
0.16%
0.48%
—
0.02%
Strategic Partners
0.54%
—
0.50%
—
(0.04%)
—
Total (Foreign Investors)
4.77%
12.22%
4.68%
12.26%
(0.09%)
0.04%
Ownership’s Value Ratio by Investor Classification (SAR bln)
Investor Classification
Sept. 30, 2025
Oct. 30, 2025
Change in Ownership
Equity
Issued Shares
Free Float
Equity
Issued Shares
Free Float
Institutional
8866.65
95.15%
86.65%
9217.19
95.34%
86.98%
350.54
Non-Institutional
451.48
4.85%
13.35%
450.71
4.66%
13.02%
(0.77)
Total
9318.13
100%
100%
9667.90
100%
100%
349.77