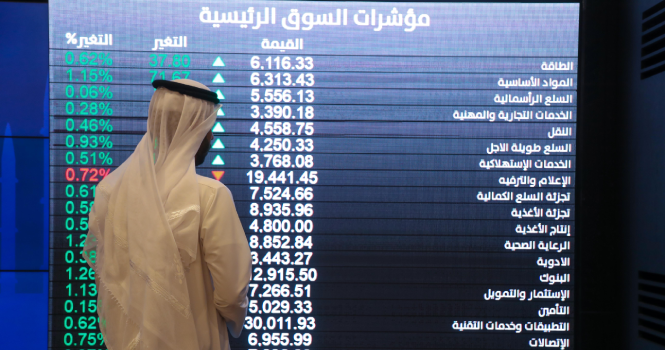
Tadawul trading screen
The market capitalization of the Saudi Exchange (Tadawul) rose 0.58%, or SAR 54.19 billion, week-on-week (WoW) to about SAR 9.403 trillion in the week ended Oct. 9, according to data issued by Tadawul. 
Foreign investors’ ownership accounted for 4.76% of the total market capital.
Ownership Value by Nationality and Investor Type – (SAR bln)
Investor Type
Oct. 2, 2025
Oct. 9, 2025
Change
Saudi Investors
Retail
159.42
160.65
1.23
High-Net-Worth Investors
267.97
268.97
1.00
Individual Professional Investors
473.96
477.34
3.38
Individual DPMs
17.07
17.20
0.13
Total (Retail)
918.42
924.15
5.74
Corporates
1622.76
1637.24
14.48
Mutual Funds
299.79
303.03
3.24
Government Entities
5910.62
5938.57
27.95
Institutional DPMs
76.86
77.77
0.91
Total (Corporate Investors)
7910.03
7956.61
46.58
Total (Saudi Investors)
8828.45
8880.76
52.32
GCC Investors
Individuals
5.01
5.05
0.04
Institutions
65.78
65.78
—
DPMs
3.95
3.99
0.05
Total (GCC Investors)
74.75
74.83
0.08
Foreign Investors
SWAP Holders
2.28
2.32
0.04
Foreign Residents
19.55
19.87
0.33
QFIs
358.53
361.67
3.14
DPMs
14.51
15.65
1.15
Strategic Partners
51.09
48.23
(2.86)
Total (Foreign Investors)
445.95
447.75
1.80
9349.15
9403.34
54.19
Ownership Ratio by Nationality Investor Type
Investor Type
Oct. 2, 2025
Oct. 9, 2025
Change
Issued Shares
Free Float
Issued Shares
Free Float
Issued Shares
Free Float
Saudi Investors
Retail
1.71%
4.72%
1.71%
4.71%
—
(0.01%)
High-Net-Worth Investors
2.87%
7.88%
2.86%
7.84%
(0.01%)
(0.04%)
Individual Professional Investors
5.07%
11.03%
5.08%
10.98%
0.01%
(0.06%)
Individual DPMs
0.18%
0.50%
0.18%
0.50%
—
—
Total (Retail)
9.82%
24.14%
9.83%
24.04%
—
(0.10%)
Corporates
17.36%
40.03%
17.41%
40.06%
0.05%
0.03%
Mutual Funds
3.21%
7.37%
3.22%
7.42%
0.02%
0.05%
Government Entities
63.22%
12.62%
63.15%
12.58%
(0.07%)
(0.05%)
Institutional DPMs
0.82%
2.17%
0.82%
2.17%
—
0.01%
Total (Corporate Investors)
84.61%
62.19%
84.61%
62.24%
0.01%
0.05%
Total (Saudi Investors)
94.43%
86.33%
94.44%
86.27%
0.01%
(0.06%)
GCC Investors
Individuals
0.05%
0.16%
0.05%
0.16%
—
—
Institutions
0.70%
1.16%
0.70%
1.16%
—
0.01%
DPMs
0.04%
0.12%
0.04%
0.12%
—
—
Total (GCC Investors)
0.80%
1.44%
0.80%
1.44%
—
0.01%
Foreign Investors
SWAP Holders
0.02%
0.07%
0.02%
0.07%
—
—
Foreign Residents
0.21%
0.60%
0.21%
0.60%
—
0.01%
QFIs
3.83%
11.12%
3.85%
11.13%
0.01%
0.01%
DPMs
0.16%
0.45%
0.17%
0.48%
0.01%
0.03%
Strategic Partners
0.55%
—
0.51%
—
(0.03%)
—
Total (Foreign Investors)
4.77%
12.24%
4.76%
12.28%
(0.01%)
0.05%
Ownership’s Value Ratio by Investor Type (SAR bln)
Investor Type
Oct. 2, 2025
Oct. 9, 2025
Change in Ownership
Equity
Issued Shares
Free Float
Equity
Issued Shares
Free Float
Institutional
8897.20
95.17%
86.65%
8948.80
95.17%
86.69%
51.60
Non-Institutional
451.95
4.83%
13.35%
454.54
4.83%
13.31%
2.59
Total
9349.15
100%
100%
9403.34
100%
100%
54.19
Tadawul trading screen
The market capitalization of the Saudi Exchange (Tadawul) rose 0.58%, or SAR 54.19 billion, week-on-week (WoW) to about SAR 9.403 trillion in the week ended Oct. 9, according to data issued by Tadawul.
Foreign investors’ ownership accounted for 4.76% of the total market capital.
Ownership Value by Nationality and Investor Type – (SAR bln)
Investor Type
Oct. 2, 2025
Oct. 9, 2025
Change
Saudi Investors
Retail
159.42
160.65
1.23
High-Net-Worth Investors
267.97
268.97
1.00
Individual Professional Investors
473.96
477.34
3.38
Individual DPMs
17.07
17.20
0.13
Total (Retail)
918.42
924.15
5.74
Corporates
1622.76
1637.24
14.48
Mutual Funds
299.79
303.03
3.24
Government Entities
5910.62
5938.57
27.95
Institutional DPMs
76.86
77.77
0.91
Total (Corporate Investors)
7910.03
7956.61
46.58
Total (Saudi Investors)
8828.45
8880.76
52.32
GCC Investors
Individuals
5.01
5.05
0.04
Institutions
65.78
65.78
—
DPMs
3.95
3.99
0.05
Total (GCC Investors)
74.75
74.83
0.08
Foreign Investors
SWAP Holders
2.28
2.32
0.04
Foreign Residents
19.55
19.87
0.33
QFIs
358.53
361.67
3.14
DPMs
14.51
15.65
1.15
Strategic Partners
51.09
48.23
(2.86)
Total (Foreign Investors)
445.95
447.75
1.80
9349.15
9403.34
54.19
Ownership Ratio by Nationality Investor Type
Investor Type
Oct. 2, 2025
Oct. 9, 2025
Change
Issued Shares
Free Float
Issued Shares
Free Float
Issued Shares
Free Float
Saudi Investors
Retail
1.71%
4.72%
1.71%
4.71%
—
(0.01%)
High-Net-Worth Investors
2.87%
7.88%
2.86%
7.84%
(0.01%)
(0.04%)
Individual Professional Investors
5.07%
11.03%
5.08%
10.98%
0.01%
(0.06%)
Individual DPMs
0.18%
0.50%
0.18%
0.50%
—
—
Total (Retail)
9.82%
24.14%
9.83%
24.04%
—
(0.10%)
Corporates
17.36%
40.03%
17.41%
40.06%
0.05%
0.03%
Mutual Funds
3.21%
7.37%
3.22%
7.42%
0.02%
0.05%
Government Entities
63.22%
12.62%
63.15%
12.58%
(0.07%)
(0.05%)
Institutional DPMs
0.82%
2.17%
0.82%
2.17%
—
0.01%
Total (Corporate Investors)
84.61%
62.19%
84.61%
62.24%
0.01%
0.05%
Total (Saudi Investors)
94.43%
86.33%
94.44%
86.27%
0.01%
(0.06%)
GCC Investors
Individuals
0.05%
0.16%
0.05%
0.16%
—
—
Institutions
0.70%
1.16%
0.70%
1.16%
—
0.01%
DPMs
0.04%
0.12%
0.04%
0.12%
—
—
Total (GCC Investors)
0.80%
1.44%
0.80%
1.44%
—
0.01%
Foreign Investors
SWAP Holders
0.02%
0.07%
0.02%
0.07%
—
—
Foreign Residents
0.21%
0.60%
0.21%
0.60%
—
0.01%
QFIs
3.83%
11.12%
3.85%
11.13%
0.01%
0.01%
DPMs
0.16%
0.45%
0.17%
0.48%
0.01%
0.03%
Strategic Partners
0.55%
—
0.51%
—
(0.03%)
—
Total (Foreign Investors)
4.77%
12.24%
4.76%
12.28%
(0.01%)
0.05%
Ownership’s Value Ratio by Investor Type (SAR bln)
Investor Type
Oct. 2, 2025
Oct. 9, 2025
Change in Ownership
Equity
Issued Shares
Free Float
Equity
Issued Shares
Free Float
Institutional
8897.20
95.17%
86.65%
8948.80
95.17%
86.69%
51.60
Non-Institutional
451.95
4.83%
13.35%
454.54
4.83%
13.31%
2.59
Total
9349.15
100%
100%
9403.34
100%
100%
54.19